Chapter 22 W - The Economics of Developing
Countries
|
Chapter 22
The Economies of Developing Countries
Note: This chapter is online on our textbook's
website:
http://highered.mcgraw-hill.com/sites/dl/free/0073365947/628797/Chapter22W.pdf
Introduction
Nearly half of the world population, 2.6 million people,
live on less tha $2 a day and about 1 billion people live on
less than $1 a day.
The world is often divided into two broad categories of
countries:
- the More Developed Countries (MDCs in white on the
map below),
Our textbook calls these "Industrially Advanced
Countries" or IACs and
- the Less Developed Countries (LDCs in yellow)
Our textbook calls these the "Developing Countries" or
DVCs
Such a broad regionalization scheme is likely to be
overly simplistic, yet it commonly used and it can be quite
useful. Often different terms are used to describe each
region. Think of other terms that you have heard to describe
the MDCs and the LDCs. Here is my list:
|
More Developed Countries
(MDC)
|
Less Developed Countries
(LDC)
|
|
Developed Countries
|
Underdeveloped Countries
|
|
Industrialized Countries
|
Agricultural Countries
|
|
First World*
|
Third World *
|
|
Haves
|
Have Nots
|
|
Rich Countries
|
Poor Countries
|
|
The North
|
The South
|
|
Industrially Advanced Countries
(IACs)
|
Developing Countries (DVCs)
|
|
THE GLOBAL NORTH
|
THE GLOBAL SOUTH
(This is becoming more popular)
|
|
High Income Economies (World
Bank)
|
Middle and Loow Income Economies (World
Bank)
|
One set of terms that is being used less and less is:
First World Countries and Third World Countries - Why? Well,
what is the Second World? How can you have a first and a
third without a second? The Second World used to be the
command economy (communist) countries of the Soviet Union,
Eastern Europe, China, North Korea, Cuba, Vietnam, and a few
other countries. With the collapse of communism in most of
these countries the "Second World" no longer exists. Theterm
"the global south" is being used more and more often.
What criteria is commonly used to divide the world into
the MDCs and the LDCs?
I have selected some of the most commonly used
Measures of Economic Development:
- GDP per capita
- Population Growth
- Occupational Structure of the Labor Force
- Urbanization
- Consumption per capita
- Infrastructure
- Social Conditions
- literacy rate
- life expectancy
- health care
- caloric intake
- infant mortality
- other
Carefully examine the maps of each measure below. Try to
get a general idea of how different areas of the world
compare in terms of their level of economic development.
First try to categorize each area as either More Developed
or Less Developed. Then try to rank them from the least
developed to the most developed.
It should be noted that great disparities exist within an
area and within individual countries. Nevertheless, the
terms are commonly used and we should be familiar with their
meanings AND THEIR GEOGRAPHY.
One other thing should be noted. These are INDICATORS or
the level of development, not the causes of causes of
development. They help us categorize countries as being
richer or pooer, but they do not CAUSE a country to be rich
or poor.
A good source of data, tables, and maps of economic data
on the world's countries is http://www.nationmaster.com
Measures of Economic Development:
GDP per capita or per capita income
The World Bank uses GDP per capita to classify
MDCs as "high income economies" and LDCs as either
"middle income economies" or "low income economies". This
map is a little old. Due to inflation the World Bank
raises the income cut-off points each year.
- high income economies: over $11,115 per captia
income
- middle income economies: $906 to $11,115
- low income economies: less than $906 per capita
income
- Map
and Bar Graph
Population Growth
-
Occupational Structure of the Labor Force (% of
labor force in agriculture)
Urbanization (% of population living in urban
areas)
Consumption per capita
- Energy Consumption
- Televisions
Infrastructure
Social Conditions
- literacy rate
- life expectancy

- health care
- caloric intake
- infant mortality
SUMMARY
After looking at allof these maps the general
pattern that should be apparent is that Africa
(especiall Africa south of the Sahra Desert) is the
poorest region followed by south Asia, the the rest of
Asia then South America, Eastern Europe, and Russia.
The richest regions are North America, Europe,
Australia and Japan. Remember, not ALL indicators of
economic development will support this pattern AND
there are pockets of wealth in the poor areas and
pockets of poverty inthe rich areas.
Definitions of the Measures of
Economic Development
GDP per capita
For the GDP PER CAPITA of individual countries see:
Map
and Bar Graph
GDP is the total market value of
all final goods and services produced in a country in one
year. It is a measure of economic activity, or how
much is produced in a country. The more that a country
produces per person , the more "developed" it is assumed to
be.
BUT, we must use GDP PER CAPITA data when comparing
countries. To understand why answer these questions:
- Which country produces more (has a higher GDP), India
or Switzerland?
- Which is more "developed"?
The GDP of India is $336 billion and the GDP of
Switzerland is $288 billion. India produces more than does
Switzerland, but everybody would agree that Switzerland is
more economically advanced. Why?
The answer is population. the population of India is 988
million and the population of Switzerland is 7 million.
Therefore we must compare GDP PER CAPITA. To calculate GDP
per capita (or income per person) we divide the GNP by the
population. The GDP per capita of Switzerland is $40,630 and
the GDP per capita of India is $ 340.
Remember, always use GDP PER CAPITA when comparing the
economic conditions of different countries.
Population Growth
Map
and Bar Graph
In general, poorer countries have more rapid rates of
population growth. Compare the GDP per capita map with
the population growth rate map to verify that this general
trend is true. You may have to go back a forth between them
several times checking a different region of the world each
time.
Rapid population growth is a recent phenomenon in the
world. I correlates directly with "modern econmic
growth".
World population reached:
- 1 billion in 1804,
- 2 billion in 1927 (123 years later)
- 3 billion in 1960 (33 years)
- 4 billion in 1974 (13 years)
- 5 billion in 1987 (12 years)
- 6 billion in 1999 (12 years)
- 7 billion in 2013 (14 years - projected)
- 8 billion in 2028 (15 years - projected)
- 10.7 (high) or 8.9 (middle) or 7.3 (low) billion
projected for 2050
Even though population growth rates seem small (1%, 2%
3%, or maybe 4%) they have a big impact. a useful way to see
this is by using the "Rule of 70".
The rule of 70 is a way to ESTIMATE the number of years
it takes for something to DOUBLE if you know the annual
percentage growth rate. Therefore, the population of the
United States with an annual population growth rate of 1%
will double in about 70 years IF THE POPULATION GROWTH RATE
REMAINS AT 1%. The population of the country of Mozambique,
Southern Africa, with an annual population growth rate of 4%
will double in 17.5 years, quadruple in 35 years and
increase by a factor of 8 in 70 years IF THE POPULATION
GROWTH RATE REMAINS AT 4%. So a small change in the
population growth rate results in significant increase in
population. You should now examine table I-1 of your
textbook and see how well the rule of 70 calculates the
population doubling time. (Note: the textbook uses the rate
of "Natural Increase" to measure the population growth
rate.)
Occupational Structure of the Labor
Force
Map
and Bar Graph
Economic geographers divide economic activities into
primary activities, secondary activities, and tertiary
activities. (Some add quaternary activities and quinary
activities, but we will not.)
PRIMARY ACTIVITIES are those that directly remove
resources from the earth. Generally they include
AGRICULTURE, MINING, fishing, and lumbering.
SECONDARY ACTIVITIES involve converting resources into
finished products. These are the MANUFACTURING
activities.
TERTIARY ACTIVITIES comprise the SERVICE sector of the
economy. The tertiary activities include retailing,
transportation, education, banking, etc.
As countries develop the occupational structure of the
labor force changes. In LDCs most people are engaged in
primary activities. In high income countries like the United
states most people are involved with the tertiary
sector.
Urbanization
Map
and Bar Graph
Urbanization is the percentage of a
country's population who live in urban areas. Urban
areas generally means in towns and cities of 2,500 or more
people. Currently just less than half of the worlds
population live in urban areas. Generally as countries
develop urbanization increases.
Note the high urbanization found in the more developed
countries AND in South America.
Consumption per capita
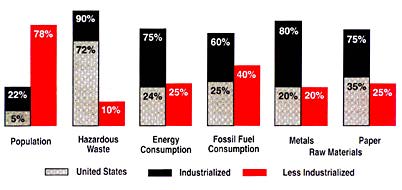
Consumption per person is a good indicator of
development. The richer a country is, the more its citizens
consume. This map shows the energy consumption patterns for
the world. Similar maps could be made for "televisions per
capita" or "cars per capita".
One consequence of consumption is pollution:

Carbon dioxide (CO2) is emitted when fossil fuels are
used. Scientists are studying the connection between CO2
build up in the atmosphere ant global warming. this chart
shows CO2 emissions for various countries
Infrastructure [wwtrans]
A country's infrastructure is defined by our author as
"the foundations of a society: urban
centers, transport networks, communications, energy
distribution systems, farms, factories, mines, and such
facilities as schools, hospitals, postal services, and
police and armed forces."
This map shows the state of development of the
transportation system as a measure of its length per area of
land. The darker the color the more developed is the
transportation system and hence, a greater the degree of
economic development is assumed.
Social Conditions
There are many other measures of economic development.
Many refer to the social conditions of a country. Here is a
short list.
- literacy rate
- life expectancy
- health care
- caloric intake
- infant mortality
(deaths of children under the age of one per 1000 people
in the population)
- other
Human Development Index
GNP per capita is the most used indicator of development
yet there are some significant problems with it. Therefore,
the United Nations Development Program (UNDP) computes a
Human Development Index for each country each year. The
human development index (HDI), composed of three
indicators:
- life expectancy,
- education (adult literacy and combined secondary and
tertiary school enrollment) and
- real GDP per capita. (Note: for our purposes, GNP and
GDP mean the same thing and they are synonymous with
income.)
To see the Human Development Index for individual
countries go to: http://www.undp.org/hdro/98hdi1.htm
LDCs
Is it appropriate to divide the world into the More
Developed Countries (MDCs) and the Less Developed Countries
(LDCs)? Some economists and geographers say "no" since all
countries have more developed and less developed areas and
because the most commonly used measure of development (GNP
per capita) masks the unequal distribution of income within
a country. Yet, I believe that it is useful regionalization
scheme since it is still used by so many people.
We also noted that there are several commonly used
synonyms for MDCs and LDCs. Here
is the list again.
Here is a map showing one view of the less developed
world.
Note that regions are inventions of geographers and
different geographers, using different criteria, may come up
with different regions. Generally, most people would
classify the following areas as LDC's:
- Sub-Saharan Africa
- South Asia
- Southeast Asia
- China *
- North Africa and Southwest Asia
- Middle America
- South America
- the Pacific area
The more developed areas generally include:
- North America
- Japan *
- Europe
- Australia / New Zealand
- Russia
One final note: Is China an LDC or an MDC? China is
definitely a less developed country with a GNP per capita of
only $620.
International Distribution of Income
Look at the following:
Comments? Why not post your comments on the discussion
forum?
Where do most of the People Live?
Do most of the world's people live in MDCs or LDCs? Check
out this map of population densities:

World's 10 Most Populous Countries:
|
Rank
|
Country
|
Population
|
|
1
|
China
|
1,196,980,000
|
|
2
|
India
|
909,150,000
|
|
3
|
United States
|
262,530,000
|
|
4
|
Indonesia
|
193,680,000
|
|
5
|
Brazil
|
159,690,000
|
|
6
|
Russia
|
150,500,000
|
|
7
|
Pakistan
|
129,630,000
|
|
8
|
Japan
|
125,360,000
|
|
9
|
Bangladesh
|
119,370,000
|
|
10
|
Nigeria
|
97,3000,000
|
TEXTBOOK CHAPTER OUTLINE
Chapter 22 - Economic growth and the Less Developed
Countries
PAY CLOSE ATTENTION TO THE HIGHLIGHTED
SECTIONS
I. The Rich and the Poor
A. Industrially advanced countries (IACs)
include the U.S., Canada, Australia, New Zealand, Japan,
and most of western Europe. They have developed market
economies based on large stocks of capital goods,
advanced technologies, and a well-educated labor force.
They have a high per capita output, as seen in
Figure
22-1.
B. Developing countries (DVCs) are 107
unindustrialized nations heavily committed to
agriculture. They have low rates of literacy, high
unemployment, rapid population growth, and their exports
are largely agricultural or raw materials. Capital
equipment is scarce, production technologies are
primitive, and productivity is low. More than 60 percent
of the world’s population lives in these nations,
which can be divided into two groups (Figure
22-1).
1. The first group consists of
"middle-income" DVCs with an average annual per capita
output in 1999 of $2,000, but with a range from $756
to $9,265 per capita.
2. The low-income group is the poorest with average
output per capita of only $410 and a range to $755.
Dominating this group are India, China, and the
sub-Saharan African nations.
C. Comparisons highlight income
disparities.
|
1. U.S. 1999 GDP was more than the total
output of the poorest 109 countries
combined.
2. The U.S. has 5 percent of the
population but produces 27 percent of the
world’s output.
3. The largest U.S. corporations have
sales greater than most DVC nations’
output. General Motors had sales greater than
the output value of all but 22 lower-income
nations of the world.
4. The assets of the three wealthiest
people in the world exceeded the combined GDPs
of the 48 poorest nations.
|

|
D. Growth, Decline, and Income Gaps
1. DVCs such as China, Malaysia and Thailand
have achieved high annual growth rates in their GDPs
in recent decades. Several previous DVCs, such as
South Korea, Singapore, and Hong Kong have achieved
IAC status. But many DVCs, such as those in
sub-Saharan Africa, have experienced declining GDPs
per capita.
2. The absolute income gap between rich and poor
nations has been widening. For example, if per capital
income is $400 a year in a DVC, a 2% growth rate means
an $8 increase in income. Where per capita income is
$20,000 per year in an IAC, the same 2% growth rate
translates into a $400 increase in income.
E. Human realities are difficult. Implications are
great in terms of poverty and the human condition as
dramatized by the excerpt from Michael Todaro’s book
in the text. Table 22-1 highlights other socioeconomic
differences.
II. Obstacles to Economic Development
A. Natural resources must be used more
efficiently and their supplies expanded. Resource
distribution is very uneven as is evidenced by the wealth
of the OPEC countries. Often ownership of natural
resources is an issue if they belong to corporations in
industrially advanced countries. However, weak resource
bases are not necessarily impossible to overcome, as
Switzerland, Israel, and Japan have shown.
B. Human resources in DVCs have three
characteristics
1. Overpopulation is the rule. An annual
population growth of approximately 1.8 percent in
these countries means that their populations double
approximately every 35 years. This compares to an
average 0.7 percent rate of population growth in
advanced countries. It means that economic growth must
be very rapid to make any gain on population; DVC per
capita incomes are lagging behind the IACs (see Table
22-2)
a. Population growth accelerates with
economic growth as better living conditions extend
life.
b. Birth rates remain high as medical care
and sanitation cut infant mortality.
2. Population growth hinders development
because large families create obstacles to
development. They reduce the ability of households to
save, more investment is required to keep up with
increases in the labor force, an overuse of
agricultural land may occur, and massive urban
problems are generated.
3. Other reasons exist in explaining why
expansion hinders development.
a. Possible solutions include
China’s "one-child" program, but many nations
have religious and sociocultural reasons to oppose
contraception or birth control.
b. Three additional points are worth
noting.
i. The relationship between
population and economic growth is not as clear
as it seems. Japan and Hong Kong are densely
populated, but wealthy. Did the wealth come
before or after population growth rates
declined?
ii. Population growth rates for the DVCs
in general have declined in recent
decades.
iii. The traditional view is that
reduction in population growth leads to economic
development. But the "demographic transition"
theory maintains that rising incomes lead to
slower population growth. Children are viewed
more as economic liabilities as the wealth of a
country becomes greater. (Key Question
6)
4. High unemployment and underemployment are
characteristics of DVCs with rates in the vicinity of
15 to 20 percent. This may become worse as rural
populations migrate to cities in the hope of finding
jobs that are not there. Underemployment occurs when
workers are employed less time than desired or at jobs
that do not fully utilize their skills.
5. Low labor productivity occurs because there
has not been enough investment in physical or human
capital. Furthermore, often there is no
entrepreneurial class. Higher education is often
oriented toward the humanities rather than technical
areas, and some of the best workers have migrated from
their home countries, causing what is called the
"brain drain."
C. Capital accumulation is an important
focus.
1. All DVCs suffer from a lack of capital
goods—factories, machinery and equipment, public
utilities, etc. Better equipped workers would improve
productivity.
2. Increasing the stock of capital goods is
crucial because of the very limited possibility of
increasing the supply of arable land.
3. Once begun, the accumulation of capital may
be cumulative if it can raise output faster than the
population grows.
4. Domestic capital formation must come as a
result of domestic saving. A nation cannot consume
everything it produces if it wants to invest in the
future.
5. Savings potential is not promising in the
poorest countries and may require foreign investment
in these countries.
6. Another concern has been capital flight,
which occurs when citizens who have been able to save
transfer their savings to the IACs for safety and
higher returns. This is a quantitatively significant
problem.
7. Obstacles to investment include the lack of
investors but also the lack of incentive to invest.
Education and skilled workers as well as an adequate
infrastructure are needed to encourage private
investment.
8. One potential bright spot is in-kind or
nonfinancial investment in the form of surplus labor
working on the improvement of the infrastructure and
other capital improvements.
D. Technological advance is a somewhat separate
process from capital formation. In some cases DVCs are
able to transfer new technologies that are
capital-saving. Technological borrowing has aided the
rapid growth of Pacific Rim region; OPEC nations have
benefited in similar ways and the former Soviet bloc
countries and republics are seeking western technology.
On the other hand, DVCs often require technology
appropriate to their resource mixes and must develop
their own.
E. Sociocultural and institutional factors: One
intangible ingredient is the "will to develop."
1. Sociocultural obstacles to growth exist.
a. Tribal allegiances may take precedence
over national identity.
b. Religious beliefs and observances may
restrict the length of the productive workday.
c. A caste system may allocate labor
inefficiently.
2. Institutional obstacles also exist, especially
the problem of land reform in these predominantly
agricultural countries.
III. The Vicious Circle of Poverty
A. Poverty makes it difficult to grow. The
obstacles to development listed in this chapter seem to
arise from poverty. How can a country break the cycle of
poverty?
B. Increasing the rate of capital accumulation may
help, but only if the rate of population growth is
somehow slowed at the same time. (Key Question
13)
IV. The Role of Government
A. A positive role exists for government,
according to one perspective.
1. Government provides law and order.
2. The absence of entrepreneurship means that
government may have to substitute in spearheading
investment.
3. The infrastructure like education, highways,
and other government services, depend on adequate
public investment in these projects.
4. Forced saving and investment may also require
government intervention.
a. Increasing taxes is one
alternative.
b. Government can cause inflation by creating
and spending new money on public projects and by
selling bonds to banks and spending the proceeds.
The resulting inflation is like an arbitrary tax on
the economy, but there are objections to creating
investment in this way.
5. Social-institutional problems like land
ownership and population growth can be alleviated by
government policy.
B. Public sector problems exist in the DVCs.
1. Entrepreneurial ability is lacking in the
public sector, too.
2. Many DVCs have histories of government
corruption and poor administration and much of these
economies is state-owned or state-controlled.
V. Role of the Advanced Nations
A. Expanding trade may
be the simplest way to benefit DVCs, and IACs can lower
trade barriers against DVC products.
However, many countries need basic capital and assistance
to produce export.
NOTE: There is more on the "trade vs. aid" issue at the
end of this online lecture.
B. Foreign aid can take several forms.
1. Public loans and grants from governments:
In the last decade, U.S. aid has averaged about $10 to
14 billion per year, mostly administered by the Agency
for International Development (AID). Total IAC has
been $40-60 billion per year. (Global Perspective
22.2)
2. The World Bank Group, supported by about 180
member nations including the U.S., lends out capital
funds to DVC governments and also sells bonds and
guarantees and insures private loans.
a. The World Bank is a "last resort"
lending agency whose loans are limited to
productive projects for which private funds are not
available.
b. Many World Bank loans are for basic
development projects, such as infrastructure that
is needed to attract private capital.
c. The World Bank also provides technical
assistance.
d. Two World Bank affiliates supplement the
Bank’s activities: The International Finance
Corp. invests in private corporations in the DVCs;
The International Development Association (IDA)
makes "soft loans" to the poorest DVCs on more
liberal terms than the World Bank.
C. Criticism of foreign aid to DVCs takes several
forms.
1. A basic charge is that foreign aid,
like welfare programs, creates dependency.
2. The recipients of much foreign aid end up
being the bureaucracy and centralized governments of
the receiving country.
3. Corruption and misuse characterize too much
foreign aid. Many of the beneficiaries are IAC-based
consultants and multinational corporations.
4. Foreign aid declined from $58 billion in 1990
to $40 billion in 1999.
D. Private capital flows mostly from large
corporations, and private banks also enter DVCs, rising
from about $50 billion in 1990 to $250 billion in
1999.
VI. Where from here?
A. DVC policies for promoting growth. (Note
the many Structural Adjustment
Program Policies.)
1. Establishing and strengthening the rule
of law. Clearly defined and enforced property rights
bolster economic growth by ensuring that individuals
receive and retain the fruits of their labor.
2. Opening economies to international
trade.
3. Controlling population growth.
4. Encouraging foreign direct
investment.
5. Building human capital, programs which
increase basic literacy, education, and labor-market
skills help enhance economic growth.
6. Making peace with neighboring
countries.
7. Establishing independent central
banks.
8. Establishing realistic exchange rate
policies.
9. Privatizing many state run
industries.
B. IAC policies for fostering DVC growth.
1. Directing foreign aid to the poorest
DVCs, much of foreign aid from IACs is strongly
influenced by potential and military considerations.
Only one-fourth of foreign aid goes to those 10
countries whose population constitutes 70 percent of
the world’s poorest people.
2. Reducing tariffs and import quotas.
There is a TRADE VS. AID debate going
on in the development community. which is the best
way the more developed countries (IACs) can help
the less developed countries (DVCs)? Many believe
that FREE TRADE, NOT AID is the best way to help
the developing countries.
3. Providing debt relief to DVCs.
4. Admitting temporary workers while
discouraging brain drains.
5. Discouraging arms sales to the DVCs.
VIII. LAST WORD: Famine in Africa
A. Famine is not uncommon and caused about
300,000 deaths of children in Somalia in early 1990s; in
2000 an estimated 12 million people in 10 African
countries are threatened by famine.
B. Immediate cause of famine is drought, but other
causes are a more complex interaction of civil strife,
overpopulation, soil erosion, and counterproductive
public policies.
1. Civil strife has torn many countries for
decades. Somalia is one example.
2. Population growth has outstripped food
production; population growth in Africa averages 2.2%
per year but only .6% per year in IACs.
3. Ecological degradation has occurred in countries
struggling to employ marginal land for crop
production.
4. Ill-advised public policies and large
international debt are other causes:
a. Some governments spend four times as
much on arms as they do on agriculture.
b. Many African governments have followed the
policy of establishing prices of agricultural goods
at low levels to provide cheap food, but it
diminishes incentives to produce.
c. External debt of about $230 billion in 1999
force sub-Saharan countries to cut back on needed
domestic programs.
The Role of International Aid in
Third World Development
QUIZ - HOW MUCH DO WE GIVE?
- What fraction of the U. S. federal government's
budget is spent on FOREIGN AID? - See answer below
- What fraction of the U. S. GDP is spent on FOREIGN
AID? - See answer below
ANSWERS
- What fraction of the U. S. GDP is spent on FOREIGN
AID?
The US gives about 0.2% of it's GDP in foreign aid.
|
Macroeconomic Goal: Economic
Growth
Introduction
Review: What do we already know about Economic Growth?
From the 5Es lesson:
Economic Growth is one of the "5 Es of economics or one of the
five ways for a society to reduce scarcity.
Let's define Economic Growth as an increase in the ABILITY to
produce goods and services. This is not the way the term is normally
defined. Later this semester we'll discuss the various definitions of
Economic Growth, but here we'll use this more fundamental
definition:
Economic Growth is an increase in the ABILITY to
produce goods and services.
This means we are ABLE to produce more, but it doesn't necessarily
mean we do produce more. More on this later.
This type of Economic Growth is caused by:
a) more resources
b) better resources
c) better technology
If we only had more resources we could produce more goods and
services and satisfy more of our wants. This will reduce scarcity and
give us more satisfaction (more good and services). All societies
therefore try to achieve economic growth.
From Production Possibilities lesson - Economic Growth
In Macroeconomics we study three main issues:
- Unemployment (UE)
- Inflation (IN), and
- Economic Growth (EG)
We can use the production possibilities model to demonstrate how
economic growth can reduce scarcity.
Our multimedia lesson use several definitions of economic growth.
let me review them here.
Three Definitions of Economic Growth
(1) Increasing our POTENTIAL OUTPUT
I like to call this increasing our ABILITY to Produce.
this is the definition we used in the 5Es
lesson. This is the most fundamental definition of economic
growth. It is the type of economic growth used on out 5Es diagram.
We can increase our ABILITY to produce goods and services (or
increase our POTENTIAL GDP) if we get:
- more resources
- better resources, and
- better technology
Since this increase maximum output that we are able to produce
it shifts the PPF outward. On the graph below, economic growth
would cause the PPF to move from PP1 to PP2.
This doesn't necessarily mean that the economy IS producing
more, just that it CAN produce more. To achieve our new potential
levels of output we also need full employment and productive
efficiency. It could be possible to have this type of economic
growth so that we CAN produce the quantities represented by point
E, but if there is unemployment and productive inefficiency we
would be at a point beneath this new curve (maybe point C). So we
may get new resources or new technology so we CAN produce more
(point E on PP2), but if we don't use the new resources (i.e. we
have unemployment) or if we don't use the new technology (i.e. we
have productive inefficiency) , we may remain on PP1 (point
C).
(2) Increasing Output (or ACHIEVING our potential output)
The most commonly used definition of economic growth is simply
producing more. (Later we will call this INCREASING REAL GDP.)When an
economy increases its output it is often said to have achieved
economic growth. But if by producing more we are simply ACHIEVING OUR
POTENTIAL, then we could also say that it is REDUCING UNEMPLOYMENT or
ACHIEVING PRODUCTIVE EFFICIENCY. On our graph this would be
represented by moving from point D to a point on the curve: A, B, or
C).
(3) Increasing Real GDP per capita
The definition of economic growth used in our multimedia lesson on
economic growth is an increase in GDP per capita. This means
increasing output per person. GDP per capita is calculated by
dividing output by the population.
From the AS - AD Lesson:
Economic Growth
What about economic growth? In an earlier lesson we
discussed three definitions of economic growth
- Increasing our POTENTIAL OUTPUT
- Increasing Output, and
- Increasing Real GDP per capita
(1) Increasing our POTENTIAL OUTPUT
I like to call this increasing our ABILITY to produce.
This is the definition we used in the 5
Es lesson. This is the most fundamental definition of
economic growth. It is the type of economic growth used on our
5 Es diagram.
We can increase our ABILITY to produce goods and services
(or increase our POTENTIAL GDP) if we get:
- more resources
- better resources, and
- better technology
Since this increases maximum output that we are able to
produce it shifts the PPF outward. On the graph below, economic
growth would cause the PPF to move from PP1 to PP2.
This doesn't necessarily mean that the economy IS producing
more, just that it CAN produce more. To achieve our new
potential levels of output we also need full employment and
productive efficiency. It could be possible to have this type
of economic growth so that we CAN produce the quantities
represented by point E, but if there is unemployment and
productive inefficiency we would be at a point beneath this new
curve (maybe point C). So we may get new resources or new
technology so we CAN produce more (point E on PP2), but if we
don't use the new resources (i.e. we have unemployment) or if
we don't use the new technology (i.e. we have productive
inefficiency) , we may remain on PP1 (point C).
In the AS-AD model INCREASING OUR POTENTIAL OUTPUT is
represented by in increase in AS.
Notice that when AS increases, the full employment level of
output increase from RDO-FE1 to RDO-FE2. this is an increase in
our potential level of output.
In the 5 Es lecture we said that economic growth is caused
by:
- more resources
- better resources, or
- better technology
An increase in the production possibilities curve is caused
by having more resources, better resources, or better
technology.
An increase in AS is caused by:
- a decrease in the price of resources
- an increase in productivity
- lower business taxes and government red tape
These are all really the same thing.
(2) Increasing Output (or ACHIEVING out potential)
The most commonly used definition of economic growth is simply
producing more. (Later we will call this INCREASING REAL GDP.)When
an economy increases its output it is often said to have achieved
economic growth. But if by producing more we are simply ACHIEVING
OUR POTENTIAL, then we could also say that it is REDUCING
UNEMPLOYMENT or ACHIEVING PRODUCTIVE EFFICIENCY. On our graph this
would be represented by moving from point D to a point on the
curve: A, B, or C).
On our AD-AS model we could illustrate this type of growth
(producing more) by an increase in AD.
Notice that output increase from RDO-EQUIL to RDO', but the
full employment level of output, which is our potential level of
output, does not change (RDO-FE).
If Ad increase so that equilibrium is at the full employment
level of output, it is analogous to going from a point inside the
production possibilities curve to a point on the curve.
(3) Increasing Real GDP per capita
The definition of economic growth used in our multimedia lesson on
economic growth is an increase in GDP per capita. This means
increasing output per person. GDP per capita is calculated by
dividing output by the population.
Economic Growth: Three Definitions - REVIEW
1. Increasing our ABILITY to Produce (INCREASING potential
output)
a. "economic growth" on the 5Es chart
b. shifting out to a new production possibilities curve
c. AS
d. causes:
(1) change in input prices (more resources)
(2) changes in the productivity of resource (better res.,
better tech.)
(3). legal-institutional environment
2. Increasing output or increasing Real GDP (ACHIEVING our
potential)
a. achieving "full employment" and "productive
efficiency" (5Es)
b. going from a point inside the PPC to a point closer to the
PPC
c. AD
d. increasing GDP per capita
e. causes:
(1) producing at a minimum cost to achieve productive
efficiency
(a) not using more resources than necessary
(b) using resources where they are best suited
(c) Using the appropriate technology
(2) more spending to AD
and achieve full employment
(a) C
(b) I
(c) G
(d) Xn
3. GDP per capita: real GDP at a
faster rate than the population
IV. Growth in the United States
A. The Facts
B. But:
- ALSO improved products and services
- ALSO added leisure
- BUT adverse environmental effects
|
Web Chapter 16W
Economic Growth in the Less Developed Countries
(LDCs)
Introduction
The world is often divided into two broad categories of
countries:
- the More Developed Countries (MDCs in white on the
map below),
Our textbook calls these IACs "industrially Advanced
countries or IACs and
- the Less Developed Countries (LDCs in yellow)
Our textbook calls these the "Developing Countries" or
DVCs
Such a broad regionalization scheme is likely to be
overly simplistic, yet it commonly used and it can be quite
useful. Often different terms are used to describe each
region. Think of other terms that you have heard to describe
the MDCs and the LDCs. Here is my list:
|
More Developed Countries
(MDC)
|
Less Developed Countries
(LDC)
|
|
Developed Countries
|
Underdeveloped Countries
|
|
Industrialized Countries
|
Agricultural Countries
|
|
First World*
|
Third World *
|
|
Haves
|
Have Nots
|
|
Rich Countries
|
Poor Countries
|
|
The North
|
The South
|
|
Industrially Advanced Countries
(IACs)
|
Less Industrialized Countries
|
|
|
|
One set of terms that is being used less and less is:
First World Countries and Third World Countries - Why? Well,
what is the Second World? How can you have a first and a
third without a second? The Second World used to be the
command economy (communist) countries of the Soviet Union,
Eastern Europe, China, North Korea, Cuba, Vietnam, and a few
other countries. With the collapse of communism in most of
these countries the "Second World" no longer exists.
What criteria is commonly used to divide the world into
the MDCs and the LDCs?
I have selected some of the most commonly used Measures
of Economic Development:
- GNP per capita
- Population Growth
- Occupational Structure of the Labor Force
- Urbanization
- Consumption per capita
- Infrastructure
- Social Conditions
- literacy rate
- life expectancy
- health care
- caloric intake
- infant mortality
- other
Carefully examine the maps of each measure below. Try to
get a general idea of how different areas of the world
compare in terms of their level of economic development.
First try to categorize each area as either More Developed
or Less Developed. Then try to rank them from the least
developed to the most developed.
It should be noted that great disparities exist within an
area and within individual countries. Nevertheless, the
terms are commonly used and we should be familiar with their
meanings AND THEIR GEOGRAPHY.
Measures of Economic Development:
- GNP per capita
- For a list of the GDP per capita of individual
countries see: [gnppctab.htm]
- Population Growth [wrpopgr]
- Occupational Structure of the Labor Force
[wraglab]
- Urbanization [wrurban]
- Consumption per capita
- Infrastructure [wwtrans]
- Social Conditions
[top]
Definitions of the Measures of
Economic Development
GNP per capita
For the GNP PER CAPITA of individual countries see:
[gnppctab.htm]
GNP is the total market value of
all final goods and services produced by a country in one
year. It is a measure of economic activity, or how
much is produced in a country. The more that a country
produces per person , the more "developed" it is assumed to
be.
BUT, we must use GDP PER CAPITA data when comparing
countries. To understand why answer these questions:
- Which country produces more (has a higher GNP), India
or Switzerland?
- Which is more "developed"?
The GNP of India is $336 billion and the GNP of
Switzerland is $288 billion. India produces more than does
Switzerland, but everybody would agree that Switzerland is
more economically advanced. Why?
The answer is population. the population of India is 988
million and the population of Switzerland is 7 million.
Therefore we must compare GNP PER CAPITA. To calculate GNP
per capita (or income per person) we divide the GNP by the
population. The GNP per capita of Switzerland is $40,630 and
the GNP per capita of India is $ 340.
Remember, always use GNP PER CAPITA when comparing the
economic conditions of different countries.
Population Growth
In general, poorer countries have more rapid rates of
population growth. Compare the GNP per capita map with the
population growth rate map to verify that this general trend
is true. You may have to go back a forth between them
several times checking a different region of the world each
time.
After comparing the maps look below for a graph showing
population growth rates by area. ("FSU is the Former Soviet
Union)
Even though population growth rates seem small (1%, 2%
3%, or maybe 4%) they have a big impact. a useful way to see
this is by using the "Rule of 70".
The rule of 70 is a way to ESTIMATE the number of years
it takes for something to DOUBLE if you know the annual
percentage growth rate. Therefore, the population of the
United States with an annual population growth rate of 1%
will double in about 70 years IF THE POPULATION GROWTH RATE
REMAINS AT 1%. The population of the country of Mozambique,
Southern Africa, with an annual population growth rate of 4%
will double in 17.5 years, quadruple in 35 years and
increase by a factor of 8 in 70 years IF THE POPULATION
GROWTH RATE REMAINS AT 4%. So a small change in the
population growth rate results in significant increase in
population. You should now examine table I-1 of your
textbook and see how well the rule of 70 calculates the
population doubling time. (Note: the textbook uses the rate
of "Natural Increase" to measure the population growth
rate.)
OPTIONAL:
For more information see: http://geography.about.com/education/geography/library/weekly/aa051800a.htm
Occupational Structure of the Labor
Force [wraglab]
Economic geographers divide economic activities into
primary activities, secondary activities, and tertiary
activities. (Some add quaternary activities and quinary
activities, but we will not.)
PRIMARY ACTIVITIES are those that directly remove
resources from the earth. Generally they include
AGRICULTURE, MINING, fishing, and lumbering.
SECONDARY ACTIVITIES involve converting resources into
finished products. These are the MANUFACTURING
activities.
TERTIARY ACTIVITIES comprise the SERVICE sector of the
economy. The tertiary activities include retailing,
transportation, education, banking, etc.
As countries develop the occupational structure of the
labor force changes. In LDCs most people are engaged in
primary activities. In high income countries like the United
states most people are involved with the tertiary
sector.
Urbanization
Urbanization is the percentage of a
country's population who live in urban areas. Urban
areas generally means in towns and cities of 2,500 or more
people. Currently just less than half of the worlds
population live in urban areas. Generally as countries
develop urbanization increases.
Note the high urbanization found in the more developed
countries AND in South America.
Consumption per capita
Consumption per person is a good indicator of
development. The richer a country is, the more its citizens
consume. This map shows the energy consumption patterns for
the world. Similar maps could be made for "televisions per
capita" or "cars per capita".
One consequence of consumption is pollution:
Carbon dioxide (CO2) is emitted when fossil fuels are
used. Scientists are studying the connection between CO2
build up in the atmosphere ant global warming. this chart
shows CO2 emissions for various countries
Infrastructure [wwtrans]
A country's infrastructure is defined by our author as
"the foundations of a society: urban
centers, transport networks, communications, energy
distribution systems, farms, factories, mines, and such
facilities as schools, hospitals, postal services, and
police and armed forces."
This map shows the state of development of the
transportation system as a measure of its length per area of
land. The darker the color the more developed is the
transportation system and hence, a greater the degree of
economic development is assumed.
Social Conditions
There are many other measures of economic development.
Many refer to the social conditions of a country. Here is a
short list.
- literacy rate
- life expectancy
- health care
- caloric intake
- infant mortality
(deaths of children under the age of one per 1000 people
in the population)
- other
Human Development Index
GNP per capita is the most used indicator of development
yet there are some significant problems with it. Therefore,
the United Nations Development Program (UNDP) computes a
Human Development Index for each country each year. The
human development index (HDI), composed of three
indicators:
- life expectancy,
- education (adult literacy and combined secondary and
tertiary school enrollment) and
- real GDP per capita. (Note: for our purposes, GNP and
GDP mean the same thing and they are synonymous with
income.)
To see the Human Development Index for individual
countries go to: http://www.undp.org/hdro/98hdi1.htm
LDCs
Is it appropriate to divide the world into the More
Developed Countries (MDCs) and the Less Developed Countries
(LDCs)? Some economists and geographers say "no" since all
countries have more developed and less developed areas and
because the most commonly used measure of development (GNP
per capita) masks the unequal distribution of income within
a country. Yet, I believe that it is useful regionalization
scheme since it is still used by so many people.
We also noted that there are several commonly used
synonyms for MDCs and LDCs. Here
is the list again.
Here is a map showing one view of the less developed
world.
Note that regions are inventions of geographers and
different geographers, using different criteria, may come up
with different regions. Generally, most people would
classify the following areas as LDC's:
- Sub-Saharan Africa
- South Asia
- Southeast Asia
- China *
- North Africa and Southwest Asia
- Middle America
- South America
- the Pacific area
The more developed areas generally include:
- North America
- Japan *
- Europe
- Australia / New Zealand
- Russia
One final note: Is China an LDC or an MDC? China is
definitely a less developed country with a GNP per capita of
only $620.
International Distribution of Income
Look at the following:
Comments? Why not post your comments on the discussion
forum?
Where do most of the People Live?
Do most of the world's people live in MDCs or LDCs? Check
out this map of population densities:
World's 10 Most Populous Countries:
|
Rank
|
Country
|
Population
|
|
1
|
China
|
1,196,980,000
|
|
2
|
India
|
909,150,000
|
|
3
|
United States
|
262,530,000
|
|
4
|
Indonesia
|
193,680,000
|
|
5
|
Brazil
|
159,690,000
|
|
6
|
Russia
|
150,500,000
|
|
7
|
Pakistan
|
129,630,000
|
|
8
|
Japan
|
125,360,000
|
|
9
|
Bangladesh
|
119,370,000
|
|
10
|
Nigeria
|
97,3000,000
|
TEXTBOOK CHAPTER OUTLINE
Chapter 16W - Economic growth and the Less Developed
Countries
PAY CLOSE ATTENTION TO THE HIGHLIGHTED
SECTIONS
I. The Rich and the Poor
A. Industrially advanced countries (IACs)
include the U.S., Canada, Australia, New Zealand, Japan,
and most of western Europe. They have developed market
economies based on large stocks of capital goods,
advanced technologies, and a well-educated labor force.
They have a high per capita output, as seen in
Figure
22-1.
B. Developing countries (DVCs) are 107
unindustrialized nations heavily committed to
agriculture. They have low rates of literacy, high
unemployment, rapid population growth, and their exports
are largely agricultural or raw materials. Capital
equipment is scarce, production technologies are
primitive, and productivity is low. More than 60 percent
of the world’s population lives in these nations,
which can be divided into two groups (Figure
22-1).
1. The first group consists of
"middle-income" DVCs with an average annual per capita
output in 1999 of $2,000, but with a range from $756
to $9,265 per capita.
2. The low-income group is the poorest with average
output per capita of only $410 and a range to $755.
Dominating this group are India, China, and the
sub-Saharan African nations.
C. Comparisons highlight income
disparities.
|
1. U.S. 1999 GDP was more than the total
output of the poorest 109 countries
combined.
2. The U.S. has 5 percent of the
population but produces 27 percent of the
world’s output.
3. The largest U.S. corporations have
sales greater than most DVC nations’
output. General Motors had sales greater than
the output value of all but 22 lower-income
nations of the world.
4. The assets of the three wealthiest
people in the world exceeded the combined GDPs
of the 48 poorest nations.
|
|
D. Growth, Decline, and Income Gaps
1. DVCs such as China, Malaysia and Thailand
have achieved high annual growth rates in their GDPs
in recent decades. Several previous DVCs, such as
South Korea, Singapore, and Hong Kong have achieved
IAC status. But many DVCs, such as those in
sub-Saharan Africa, have experienced declining GDPs
per capita.
2. The absolute income gap between rich and poor
nations has been widening. For example, if per capital
income is $400 a year in a DVC, a 2% growth rate means
an $8 increase in income. Where per capita income is
$20,000 per year in an IAC, the same 2% growth rate
translates into a $400 increase in income.
E. Human realities are difficult. Implications are
great in terms of poverty and the human condition as
dramatized by the excerpt from Michael Todaro’s book
in the text. Table 22-1 highlights other socioeconomic
differences.
II. Obstacles to Economic Development
A. Natural resources must be used more
efficiently and their supplies expanded. Resource
distribution is very uneven as is evidenced by the wealth
of the OPEC countries. Often ownership of natural
resources is an issue if they belong to corporations in
industrially advanced countries. However, weak resource
bases are not necessarily impossible to overcome, as
Switzerland, Israel, and Japan have shown.
B. Human resources in DVCs have three
characteristics
1. Overpopulation is the rule. An annual
population growth of approximately 1.8 percent in
these countries means that their populations double
approximately every 35 years. This compares to an
average 0.7 percent rate of population growth in
advanced countries. It means that economic growth must
be very rapid to make any gain on population; DVC per
capita incomes are lagging behind the IACs (see Table
22-2)
a. Population growth accelerates with
economic growth as better living conditions extend
life.
b. Birth rates remain high as medical care
and sanitation cut infant mortality.
2. Population growth hinders development
because large families create obstacles to
development. They reduce the ability of households to
save, more investment is required to keep up with
increases in the labor force, an overuse of
agricultural land may occur, and massive urban
problems are generated.
3. Other reasons exist in explaining why
expansion hinders development.
a. Possible solutions include
China’s "one-child" program, but many nations
have religious and sociocultural reasons to oppose
contraception or birth control.
b. Three additional points are worth
noting.
i. The relationship between
population and economic growth is not as clear
as it seems. Japan and Hong Kong are densely
populated, but wealthy. Did the wealth come
before or after population growth rates
declined?
ii. Population growth rates for the DVCs
in general have declined in recent
decades.
iii. The traditional view is that
reduction in population growth leads to economic
development. But the "demographic transition"
theory maintains that rising incomes lead to
slower population growth. Children are viewed
more as economic liabilities as the wealth of a
country becomes greater. (Key Question
6)
4. High unemployment and underemployment are
characteristics of DVCs with rates in the vicinity of
15 to 20 percent. This may become worse as rural
populations migrate to cities in the hope of finding
jobs that are not there. Underemployment occurs when
workers are employed less time than desired or at jobs
that do not fully utilize their skills.
5. Low labor productivity occurs because there
has not been enough investment in physical or human
capital. Furthermore, often there is no
entrepreneurial class. Higher education is often
oriented toward the humanities rather than technical
areas, and some of the best workers have migrated from
their home countries, causing what is called the
"brain drain."
C. Capital accumulation is an important
focus.
1. All DVCs suffer from a lack of capital
goods—factories, machinery and equipment, public
utilities, etc. Better equipped workers would improve
productivity.
2. Increasing the stock of capital goods is
crucial because of the very limited possibility of
increasing the supply of arable land.
3. Once begun, the accumulation of capital may
be cumulative if it can raise output faster than the
population grows.
4. Domestic capital formation must come as a
result of domestic saving. A nation cannot consume
everything it produces if it wants to invest in the
future.
5. Savings potential is not promising in the
poorest countries and may require foreign investment
in these countries.
6. Another concern has been capital flight,
which occurs when citizens who have been able to save
transfer their savings to the IACs for safety and
higher returns. This is a quantitatively significant
problem.
7. Obstacles to investment include the lack of
investors but also the lack of incentive to invest.
Education and skilled workers as well as an adequate
infrastructure are needed to encourage private
investment.
8. One potential bright spot is in-kind or
nonfinancial investment in the form of surplus labor
working on the improvement of the infrastructure and
other capital improvements.
D. Technological advance is a somewhat separate
process from capital formation. In some cases DVCs are
able to transfer new technologies that are
capital-saving. Technological borrowing has aided the
rapid growth of Pacific Rim region; OPEC nations have
benefited in similar ways and the former Soviet bloc
countries and republics are seeking western technology.
On the other hand, DVCs often require technology
appropriate to their resource mixes and must develop
their own.
E. Sociocultural and institutional factors: One
intangible ingredient is the "will to develop."
1. Sociocultural obstacles to growth exist.
a. Tribal allegiances may take precedence
over national identity.
b. Religious beliefs and observances may
restrict the length of the productive workday.
c. A caste system may allocate labor
inefficiently.
2. Institutional obstacles also exist, especially
the problem of land reform in these predominantly
agricultural countries.
III. The Vicious Circle of Poverty
A. Poverty makes it difficult to grow. The
obstacles to development listed in this chapter seem to
arise from poverty. How can a country break the cycle of
poverty?
B. Increasing the rate of capital accumulation may
help, but only if the rate of population growth is
somehow slowed at the same time. (Key Question
13)
IV. The Role of Government
A. A positive role exists for government,
according to one perspective.
1. Government provides law and order.
2. The absence of entrepreneurship means that
government may have to substitute in spearheading
investment.
3. The infrastructure like education, highways,
and other government services, depend on adequate
public investment in these projects.
4. Forced saving and investment may also require
government intervention.
a. Increasing taxes is one
alternative.
b. Government can cause inflation by creating
and spending new money on public projects and by
selling bonds to banks and spending the proceeds.
The resulting inflation is like an arbitrary tax on
the economy, but there are objections to creating
investment in this way.
5. Social-institutional problems like land
ownership and population growth can be alleviated by
government policy.
B. Public sector problems exist in the DVCs.
1. Entrepreneurial ability is lacking in the
public sector, too.
2. Many DVCs have histories of government
corruption and poor administration and much of these
economies is state-owned or state-controlled.
V. Role of the Advanced Nations
A. Expanding trade may
be the simplest way to benefit DVCs, and IACs can lower
trade barriers against DVC products.
However, many countries need basic capital and assistance
to produce export.
NOTE: There is more on the "trade vs. aid" issue at the
end of this online lecture.
B. Foreign aid can take several forms.
1. Public loans and grants from governments:
In the last decade, U.S. aid has averaged about $10 to
14 billion per year, mostly administered by the Agency
for International Development (AID). Total IAC has
been $40-60 billion per year. (Global Perspective
22.2)
2. The World Bank Group, supported by about 180
member nations including the U.S., lends out capital
funds to DVC governments and also sells bonds and
guarantees and insures private loans.
a. The World Bank is a "last resort"
lending agency whose loans are limited to
productive projects for which private funds are not
available.
b. Many World Bank loans are for basic
development projects, such as infrastructure that
is needed to attract private capital.
c. The World Bank also provides technical
assistance.
d. Two World Bank affiliates supplement the
Bank’s activities: The International Finance
Corp. invests in private corporations in the DVCs;
The International Development Association (IDA)
makes "soft loans" to the poorest DVCs on more
liberal terms than the World Bank.
C. Criticism of foreign aid to DVCs takes several
forms.
1. A basic charge is that foreign aid,
like welfare programs, creates dependency.
2. The recipients of much foreign aid end up
being the bureaucracy and centralized governments of
the receiving country.
3. Corruption and misuse characterize too much
foreign aid. Many of the beneficiaries are IAC-based
consultants and multinational corporations.
4. Foreign aid declined from $58 billion in 1990
to $40 billion in 1999.
D. Private capital flows mostly from large
corporations, and private banks also enter DVCs, rising
from about $50 billion in 1990 to $250 billion in
1999.
VI. Where from here?
A. DVC policies for promoting growth. (Note
the many Structural Adjustment
Program Policies.)
1. Establishing and strengthening the rule
of law. Clearly defined and enforced property rights
bolster economic growth by ensuring that individuals
receive and retain the fruits of their labor.
2. Opening economies to international
trade.
3. Controlling population growth.
4. Encouraging foreign direct
investment.
5. Building human capital, programs which
increase basic literacy, education, and labor-market
skills help enhance economic growth.
6. Making peace with neighboring
countries.
7. Establishing independent central
banks.
8. Establishing realistic exchange rate
policies.
9. Privatizing many state run
industries.
B. IAC policies for fostering DVC growth.
1. Directing foreign aid to the poorest
DVCs, much of foreign aid from IACs is strongly
influenced by potential and military considerations.
Only one-fourth of foreign aid goes to those 10
countries whose population constitutes 70 percent of
the world’s poorest people.
2. Reducing tariffs and import quotas.
There is a TRADE VS. AID debate going
on in the development community. which is the best
way the more developed countries (IACs) can help
the less developed countries (DVCs)? Many believe
that FREE TRADE, NOT AID is the best way to help
the developing countries.
3. Providing debt relief to DVCs.
4. Admitting temporary workers while
discouraging brain drains.
5. Discouraging arms sales to the DVCs.
VIII. LAST WORD: Famine in Africa
A. Famine is not uncommon and caused about
300,000 deaths of children in Somalia in early 1990s; in
2000 an estimated 12 million people in 10 African
countries are threatened by famine.
B. Immediate cause of famine is drought, but other
causes are a more complex interaction of civil strife,
overpopulation, soil erosion, and counterproductive
public policies.
1. Civil strife has torn many countries for
decades. Somalia is one example.
2. Population growth has outstripped food
production; population growth in Africa averages 2.2%
per year but only .6% per year in IACs.
3. Ecological degradation has occurred in countries
struggling to employ marginal land for crop
production.
4. Ill-advised public policies and large
international debt are other causes:
a. Some governments spend four times as
much on arms as they do on agriculture.
b. Many African governments have followed the
policy of establishing prices of agricultural goods
at low levels to provide cheap food, but it
diminishes incentives to produce.
c. External debt of about $230 billion in 1999
force sub-Saharan countries to cut back on needed
domestic programs.
The Role of International Aid in
Third World Development
QUIZ - HOW MUCH DO WE GIVE?
- What fraction of the U. S. federal government's
budget is spent on FOREIGN AID? - See answer below
- What fraction of the U. S. GDP is spent on FOREIGN
AID? - See answer below
ANSWERS
- What fraction of the U. S. GDP is spent on FOREIGN
AID?
The US gives about 0.2% of it's GDP in foreign aid.
|
Chapter 22
Economic Growth in the Less Developed Countries (LDCs)
For Online Lecture See: http://www.harper.cc.il.us/mhealy/eco212i/lectures/ldc/ldc.htm
I. The Rich and the Poor
A. The Industrially Advanced Countries (IACs)
B. The
Less Developed Countries
(I prefer the term "less developed countries" or LDCs.
the authors of our textbook use the term "developing countries"
or DVCs.)
1. middle income countries
annual per capita output in 2001: $745 to $9,206 per capita
(average: of $1,850)
2. low income countries
annual output per capita in 2001: up to $745 (average: $430
)
C. International Distribution of Income
- Comparisons highlight income disparities:
- U.S. 2001 GDP (almost $10 trillion) was more than the
total output of all of the DVCs combined ($6
trillion).
- The U.S. has 5 percent of the population but produces
31 percent of the world's output.
- U.S. per capita GDP is almost 250 times greater than
that of Sierra Leone, one of the world's poorest
nations.
- The largest U.S. corporations have sales greater than
most DVC nations' output. General Motors had sales greater
than the output value of all but 21 nations of the
world.
D. Where do most of the People Live? [wwpopden]
[top10pop.htm]
1. over 60% of the world's population live in
LDCs
2. WHERE?
World's 10 Most Populous Countries
|
Rank
|
Country
|
Population
|
|
1
|
China
|
1,273,111,290 (July 2001 est.)
|
|
2
|
India
|
1,029,991,145 (July 2001 est.)
|
|
3
|
United States
|
278,058,881 (July 2001 est.)
|
|
4
|
Indonesia
|
228,437,870 (July 2001 est.)
|
|
5
|
Brazil
|
174,468,575
|
|
6
|
Russia
|
145,470,197 (July 2001 est.)
|
|
7
|
Pakistan
|
144,616,639 (July 2001 est.)
|
|
8
|
Bangladesh
|
131,269,860 (July 2001 est.)
|
|
9
|
Japan
|
126,771,662 (July 2001 est.)
|
|
10
|
Nigeria
|
126,635,626
|
II. Characteristics of the LDCs: Measures of Economic
Development: [list]
For a good online review see:
http://www.harper.cc.il.us/~mhealy/g101ilec/intro/eco/ecomea/ecomeafr.htm
The title of chapter 22W is "The Economics of Developing
Countries". WHAT are LDCs
?
A. From the textbook: Developing countries (DVCs)
are:
- unindustrialized nations heavily committed to
agriculture.
- They have low rates of literacy,
- high unemployment,
- rapid population growth,
- and their exports are largely agricultural or raw
materials.
- Capital equipment is scarce,
- production technologies are primitive,
- and productivity is low
B. My list: Measures of Economic Development
LDC's have:
1. low GDP per capita [wbgnpmap]
[gnppctab.htm]
[2002
data]
- This is the most used measure of economic
development
- Problems with Using GDPpc as a measure [see
chapter
7]
2. rapid Population Growth rates[wrpopgr]
[hispopgr]
[demotran]
3. Occupational Structure of the Labor Force
[types]
[wraglab]:
high % in agriculture
4. Low Urbanization [wrurban]
5. Low Consumption per capita
6. Poorly developed Infrastructure [wwtrans]
7. Poor Social Conditions
- high literacy rates [wwlitrt]
- low life expectancy [wwlifexp]
- lacking health care
- low caloric intake
- high infant mortality [wwinfmrt]
- other
C. Websites with world data:
III. Growth, Decline, and Income gaps
A. Growth in some, Decline in others
- Several previous DVCs, such as South Korea, Singapore,
and Hong Kong have achieved IAC status.
- DVCs such as China, Malaysia, Chile, and Thailand have
achieved high annual growth rates in their GDPs in recent
decades.
- But many DVCs, such as those in sub-Saharan Africa, have
experienced declining GDPs per capita.
B. Growing Absolute Gap between the rich and the poor
http://www.globalpolicy.org/socecon/inequal/inctab.htm
- The absolute income gap between rich and poor nations
has been widening.
- For example,
- LDC: if per capita income is $400 a year in a DVC, a
2% growth rate means an $8 increase in income.
- IAC: Where per capita income is $20,000 per year in
an IAC, the same 2% growth rate translates into a $400
increase in income.
IV. The Human Realities of Poverty (p. 22W-3)
V. Obstacles to Economic Development
A. Natural Resources
- Natural resources must be used more efficiently and
their supplies expanded.
- Resource distribution is very uneven as is evidenced by
the wealth of the OPEC countries.
- Often ownership of natural resources is an issue if they
belong to corporations in industrially advanced countries.
- However, weak resource bases are not necessarily
impossible to overcome, as Switzerland, Israel, and Japan have
shown.
B. Human Resources
C. Capital Accumulation
D. Technological Advance
E. Sociocultural and Institutional Factors
VI. The Vicious Circle: They are poor because they are
poor!
A. Poverty makes it difficult to grow. The obstacles to
development listed in this chapter seem to arise from
poverty.
B. How can a country break the cycle of poverty? Increasing
the rate of capital accumulation may help, but only if the rate of
population growth is somehow slowed at the same time.
VII. The Role of Government
A. Positive Role
1. law and order
2. lack of entrepreneurship
3. infrastructure
4. forced saving and investment
5. socio-institutional problems
B. Public Sector Problems
VIII. Role of the IACs
A. Expanding Trade
1. Expanding trade may be the simplest way to
benefit DVCs, and IACs can lower trade barriers against DVC
products.
2. However, many countries need basic capital and
assistance to produce export.
B. Foreign Aid [aidquiz]
C. Private Capital Flows
I. Learning objectives - In this chapter students will learn:
A. How the World Bank distinguishes between industrial advanced
countries (high-income nations) and developing countries
(middle-income and low-income nations).
B. Some of the obstacles to economic development.
C. About the vicious cycle of poverty that afflicts low-income
nations.
D. The role of government in promoting economic development within
low-income nations.
E. How industrial nations attempt to aid low-income nations.
II. The Rich and the Poor
A. Industrially advanced countries (IACs) include the U.S.,
Canada, Australia, New Zealand, Japan, and most of Western Europe.
They have developed market economies based on large stocks of capital
goods, advanced technologies, and a well educated labor force. They
have a high per capita output, as seen in Figure 16W.1.
B. Developing countries (DVCs) are unindustrialized nations
heavily committed to agriculture. They have low rates of literacy,
high unemployment, rapid population growth, and their exports are
largely agricultural or raw materials. Capital equipment is scarce,
production technologies are primitive, and productivity is low. More
than 60 percent of the world's population lives in these nations,
which can be divided into two groups (Figure 16W.1).
1. The first group consists of "middle income" DVCs with an
average annual per capita output in 2004 of $2,190, but with a range
from $826 to $10,065 per capita.
2. The low-income group is the poorest with average output per
capita of only $510 and a range to $825. Dominating this group are
India, Indonesia, and the sub Saharan African nations.
C. Comparisons highlight income disparities.
1. U.S. 2004 GDP (almost $12 trillion) was more than twice the
total output of all of the DVCs combined ($5.5 trillion).
2. The U.S. has 5 percent of the population but produces 31
percent of the world's output.
3. U.S. per capita GDP is 207 times greater than that of Sierra
Leone, one of the world's poorest nations.
4. The largest U.S. corporations have sales greater than most DVC
nations' output. General Motors had sales greater than the output
value of all but 19 nations of the world.
D. Growth, Decline, and Income Gaps
1. DVCs such as China, Malaysia, Chile, and Thailand have achieved
high annual growth rates in their GDPs in recent decades. Several
previous DVCs, such as South Korea, Singapore, and Hong Kong have
achieved IAC status. But many DVCs, such as those in sub-Saharan
Africa, have experienced declining GDPs per capita.
2. The absolute income gap between rich and poor nations has been
widening. For example, if per capita income is $400 a year in a DVC,
a 2% growth rate means an $8 increase in income. Where per capita
income is $20,000 per year in an IAC, the same 2% growth rate
translates into a $400 increase in income.
E. Human realities are difficult. Implications are great in terms
of poverty and the human condition as dramatized by the excerpt from
Michael Todaro's book in the text. Table 16W.1 highlights other
socioeconomic differences.
III. Obstacles to Economic Development
A. Natural resources must be used more efficiently and their
supplies expanded. Resource distribution is very uneven as is
evidenced by the wealth of the OPEC countries. Often ownership of
natural resources is an issue if they belong to corporations in
industrially advanced countries. However, weak resource bases are not
necessarily impossible to overcome, as Switzerland, Israel, and Japan
have shown.
B. Human resources in DVCs have three characteristics
1. Overpopulation is the rule. An annual population growth of
approximately 1.3 percent in these countries means that their
populations double approximately every 54 years. This compares to an
average 0.7 percent rate of population growth in advanced countries.
It means that economic growth must be very rapid to make any gain on
population; DVC per capita incomes are lagging behind the IACs (see
Table 16W.2).
a. Population growth accelerates with economic growth as better
living conditions extend life.
b. Birth rates remain high as medical care and sanitation cut
infant mortality.
c. Population growth hinders development because large families
create obstacles to development. They reduce the ability of
households to save, more investment is required to keep up with
increases in the labor force, an overuse of agricultural land may
occur, and massive urban problems are generated.
d. Other reasons exist in explaining why expansion hinders
development.
e. Possible solutions include China's "one child" program, but
many nations have religious and socio-cultural reasons to oppose
contraception or birth control.
f. Three additional points are worth noting.
i. The relationship between population and economic growth is not
as clear as it seems. Japan and Hong Kong are densely populated, but
wealthy. Did the wealth come before or after population growth rates
declined?
ii. Population growth rates for the DVCs in general have declined
in recent decades.
iii. The traditional view is that reduction in population growth
leads to economic development. But the "demographic transition"
theory maintains that rising incomes lead to slower population
growth. Children are viewed more as economic liabilities as country
becomes wealthier. (Key Question 5)
2. High unemployment and underemployment are characteristics of
DVCs with rates in the vicinity of 15 to 20 percent. This may become
worse as rural populations migrate to cities in the hope of finding
jobs that are not there. Underemployment occurs when workers are
employed less time than desired or at jobs that do not fully utilize
their skills.
3. Low labor productivity occurs because there has not been enough
investment in physical or human capital. Furthermore, often there is
no entrepreneurial class. Higher education is often oriented toward
the humanities rather than technical areas, and some of the best
workers have migrated from their home countries, causing what is
called the "brain drain."
C. Capital accumulation is an important focus.
1. All DVCs suffer from a lack of capital goods-factories,
machinery and equipment, public utilities, etc. Better equipped
workers would improve productivity.
2. Increasing the stock of capital goods is crucial because of the
very limited possibility of increasing the supply of arable land.
3. Once begun, the accumulation of capital may be cumulative if it
can raise output faster than the population grows.
4. Domestic capital formation must come as a result of domestic
saving. A nation cannot consume everything it produces if it wants to
invest in the future.
5. Savings potential is not promising in the poorest countries and
may require foreign investment in these countries.
6. Another concern has been capital flight, which occurs when
citizens who have been able to save transfer their savings to the
IACs for safety and higher returns. This is a quantitatively
significant problem.
7. Obstacles to investment include the lack of investors but also
the lack of incentive to invest. Education and skilled workers as
well as an adequate infrastructure are needed to encourage private
investment.
8. One potential bright spot is in kind or nonfinancial investment
in the form of surplus labor working on the improvement of the
infrastructure and other capital improvements.
D. Technological advance is a somewhat separate process from
capital formation. In some cases DVCs are able to transfer new
technologies that are capital-saving. Technological borrowing has
aided the rapid growth of Pacific Rim region; OPEC nations have
benefited in similar ways and the former Soviet bloc countries and
republics are seeking western technology. On the other hand, DVCs
often require technology appropriate to their resource mixes and must
develop their own.
E. Socio-cultural and institutional factors: One intangible
ingredient is the "will to develop."
1. Socio-cultural obstacles to growth exist.
a. Tribal allegiances may take precedence over national
identity.
b. Religious beliefs and observances may restrict the length of
the productive workday. The "capricious universe view" may keep some
from productive activity as it is seen as pointless in the end.
c. A caste system may allocate labor inefficiently.
2. Institutional obstacles also exist, especially the problem of
land reform in these predominantly agricultural countries.
IV. The Vicious Circle of Poverty (Figure 16W.3)
A. Poverty makes it difficult to grow. The obstacles to
development listed in this chapter seem to arise from poverty. How
can a country break the cycle of poverty?
B. Increasing the rate of capital accumulation may help, but only
if the rate of population growth is somehow slowed at the same time.
(Key Question 12)
V. The Role of Government
A. A positive role exists for government, according to one
perspective.
1. Government provides law and order.
2. The absence of entrepreneurship means that government may have
to substitute in spearheading investment.
3. The infrastructure like education, highways, and other
government services, depend on adequate public investment in these
projects.
4. Forced saving and investment may also require government
intervention.
a. Increasing taxes is one alternative.
b. Government can cause inflation by creating and spending new
money on public projects and by selling bonds to banks and spending
the proceeds. The resulting inflation is like an arbitrary tax on the
economy, but there are objections to creating investment in this
way.
5. Social institutional problems like land ownership and
population growth can be alleviated by government policy.
B. Public sector problems exist in the DVCs.
1. Entrepreneurial ability is lacking in the public sector,
too.
2. Many DVCs have histories of government corruption and poor
administration and much of these economies is state-owned or
state-controlled. (Global Perspective 16W.1)
VI. Role of the Advanced Nations
A. Expanding trade may be the simplest way to benefit DVCs, and
IACs can lower trade barriers against DVC products. However, many
countries need basic capital and assistance to produce export.
B. Foreign aid can take several forms.
1. Public loans and grants from governments: In the last decade,
U.S. aid has averaged about $10 to 16 billion per year, mostly
administered by the Agency for International Development (AID). Total
IAC aid in 2003 was $69 billion. (Global Perspective 16W.2)
2. The World Bank Group, supported by about 184 member nations
including the U.S., lends out capital funds to DVC governments and
also sells bonds and guarantees and insures private loans.
a. The World Bank is a "last-resort" lending agency whose loans
are limited to productive projects for which private funds are not
available.
b. Many World Bank loans are for basic development projects, such
as infrastructure that is needed to attract private capital.
c. The World Bank also provides technical assistance.
d. Two World Bank affiliates supplement the Bank's activities: The
International Finance Corp. invests in private corporations in the
DVCs; The International Development Association (IDA) makes "soft
loans" to the poorest DVCs on more liberal terms than the World
Bank.
C. Criticism of foreign aid to DVCs takes several forms.
1. A basic charge is that foreign aid, like welfare programs,
creates dependency.
2. The recipients of much foreign aid end up being the bureaucracy
and centralized governments of the receiving country.
3. Corruption and misuse characterize too much foreign aid. Many
of the beneficiaries are IAC-based consultants and multinational
corporations.
4. Foreign aid declined from $68 billion in 1995 to $61 billion in
2000, in part because of the end of the Cold War.
D. Private capital flows mostly from large corporations, and
private banks also enter DVCs, rising from about $44 billion in 1990
to $199 billion in 2003.
VII. Where from here?
A. DVC policies for promoting growth.
1. Establishing and strengthening the rule of law. Clearly defined
and enforced property rights bolster economic growth by ensuring that
individuals receive and retain the fruits of their labor.
2. Opening economies to international trade.
3. Controlling population growth.
4. Encouraging foreign direct investment.
5. Building human capital, programs which increase basic literacy,
education, and labor-market skills help enhance economic growth.
6. Making peace with neighboring countries.
7. Establishing independent central banks.
8. Establishing realistic exchange rate policies.
9. Privatizing many state-run industries.
B. IAC policies for fostering DVC growth.
1. Directing foreign aid to the poorest DVCs, much of foreign aid
from IACs is strongly influenced by potential and military
considerations. Only one-fourth of foreign aid goes to those 10
countries whose population constitutes 70 percent of the world's
poorest people.
2. Reducing tariffs and import quotas.
3. Providing debt forgiveness to the poorest DVCs.
4. Admitting temporary workers while discouraging brain
drains.
5. Discouraging arms sales to the DVCs.
VIII. LAST WORD: Famine in Africa
A. Famine is not uncommon and caused about 300,000 deaths of
children in Somalia in early 1990s; in 2003 an estimated 10 million
people in several African countries are threatened by famine.
B. Immediate cause of famine is drought, but other causes are a
more complex interaction of civil strife, overpopulation, soil
erosion, and counterproductive public policies.
1. Civil strife has torn many countries for decades. Somalia is
one example.
2. Population growth has outstripped food production; population
growth in Africa is projected to be 2% annually, versus only .3% per
year in IACs.
3. Ecological degradation has occurred in countries struggling to
employ marginal land for crop production.
4. Ill advised public policies and large international debt are
other causes:
a. Some governments spend four times as much on arms as they do on
agriculture.
b. Many African governments have followed the policy of
establishing prices of agricultural goods at low levels to provide
cheap food, but it diminishes incentives to produce.
5. External debt of about $218 billion in 2003 forced sub-Saharan
countries to cut back on needed domestic programs.
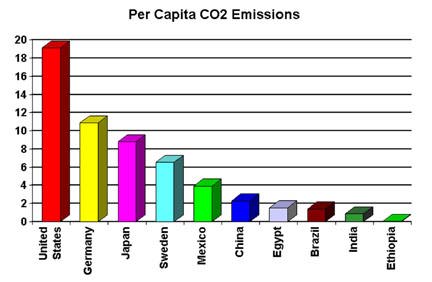