International Trade: Specialization, Exchange, and
Efficiency
Lectures
20a Why We Trade: Comparative Advantage
INTRODUCTION / REVIEW Major economic changes have been occurring in the last few decades. Countries all around the world, including the United States are currently engaged in a process of globalization, or structural adjustment. This includes, among other things, moving toward free trade. Globalization and the removal of trade barriers is occurring now and it will continue to occur. In the previous lecture it was mentioned that much of what we hear in the popular press is contrary to what we are going to learn in this course. This is very true when discussing globalization. For example, read the following quotes from the CNN news article: Dobbs: New Congress must show courage [http://www.cnn.com/2006/US/11/28/Dobbs.Nov29/index.html]. Lou Dobbs, CNN News commentator and best-selling author,
says:
Then read the following quotes taken from our textbook (19th edition):
|
I. REVIEW: Why study International Trade (Specialization, Exchange, and Efficiency)?
A. Structural Adjustment Policies1. Privatization
2. Promotion of Competition
3. Limited and Reoriented Role for Government
4. Price Reform: Removing Controls
5. Joining the World Economy
6. Macroeconomic StabilityB. Specialization and Exchange Reduces SCARCITY
1. Productive Efficiency: using resources where best suited (5Es)2. Production Possibilities vs CONSUMPTION Possibilities (graph)
II. Introduction
A. Should We Have Free Trade With Other Countries?
B. Why AND Why Not?
- Spend a few minutes writing down your ideas.
- State your opinion and defend it
- also, state arguments that oppose your opinion
C. Many people use anecdotal evidence to oppose freer trade
D. but most economists favor freer trade
III. The Economic Basis for Specialization and Exchange -- Trade
A. Pre-quiz (yellow page)- Do you think like an economist?
B. Why we specialize and exchange?1. What would life be like if YOU were self-sufficient?2. Trade: advantages and disadvantages
a. advantage:
- larger total output / higher living standards
- lower prices
b. disadvantage:
- less independence / more interdependence
3. The basis for specialization and exchange
a. differences in resource endowments
b. differences in preferences
c. differences in productivity (MORE BELOW)1) define productivity
2) define absolute advantage
3) a good lawyer trades with a good mechanicd. differences in opportunity costs (MORE BELOW)
1) define opportunity cost
2) define comparative advantage
3) The lawyer/mechanic argument revisedC. Differences in Productivity: Absolute Advantage
1. production possibilities: self sufficiency
2. specialization
3. trading possibilities: more total outputD. Differences in Opportunity Costs: Comparative Advantage
1. production possibilities: self sufficiency
2. specializationa. comparative advantage
b. calculating opportunity costs3. trading possibilities: more total output
4. trade with increasing costsa. review: law of increasing costs
b. result: specialization is less than 100%5. terms of trade
a. definition
b. minimum and maximum terms of trade
c. actual terms of trade
20b International Trade |
IV. International Trade
A. Unique Aspects of International Trade1. mobility differences
2. currency differences
3. politicsB. The Key Facts of International Trade
2013: https://www.census.gov/foreign-trade/statistics/highlights/top/top1312yr.html
2014: http://trade.gov/mas/ian/build/groups/public/@tg_ian/documents/webcontent/tg_ian_003364.pdf
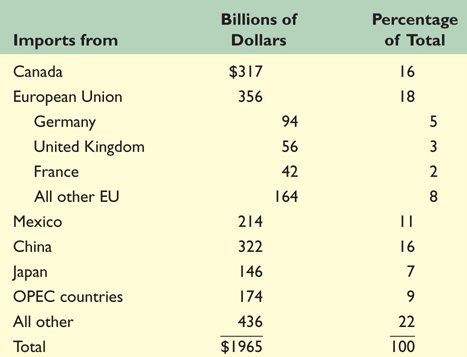
2017: https://www.census.gov/foreign-trade/statistics/highlights/top/top1712yr.html1. US Trading PartnersFrom whom do we buy the most ?
2017 Imports
https://www.census.gov/foreign-trade/statistics/highlights/top/top1712yr.html#imports
2007
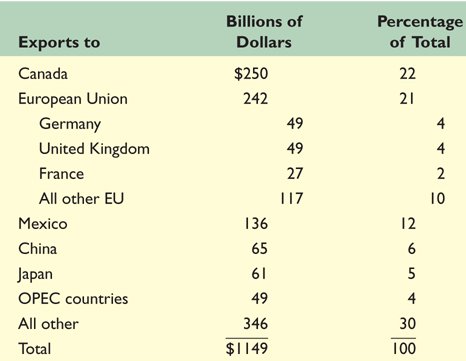
To whom do we sell the most ?
2017 Exports
https://www.census.gov/foreign-trade/statistics/highlights/top/top1712yr.html#exports
2007
2017 Total Trade
https://www.census.gov/foreign-trade/statistics/highlights/top/top1712yr.html
2. What do we trade?
What are the principal US exports?
Principal US Exports of Goods
2017: http://www.worldstopexports.com/united-states-top-10-exports/
- Machinery including computers: US$201.7 billion (13% of total exports)
- Electrical machinery, equipment: $174.2 billion (11.3%)
- Mineral fuels including oil: $138 billion (8.9%)
- Aircraft, spacecraft: $131.2 billion (8.5%)
- Vehicles: $130.1 billion (8.4%)
- Optical, technical, medical apparatus: $83.6 billion (5.4%)
- Plastics, plastic articles: $61.5 billion (4%)
- Gems, precious metals: $60.4 billion (3.9%)
- Pharmaceuticals: $45.1 billion (2.9%)
- Organic chemicals: $36.2 billion (2.3%)
2007: (in Billions of Dollars)
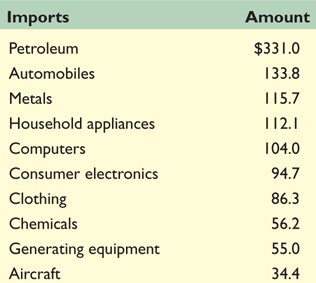
What are the principal US Imports?
Principal US Imports of Goods (2007, in Billions of Dollars)
2017: http://www.worldstopexports.com/united-states-top-10-imports/
- Electrical machinery, equipment: US$356.8 billion (14.8% of total imports)
- Machinery including computers: $349.1 billion (14.5%)
- Vehicles : $294.6 billion (12.2%)
- Mineral fuels including oil: $204.2 billion (8.5%)
- Pharmaceuticals: $96.4 billion (4%)
- Optical, technical, medical apparatus: $86.2 billion (3.6%)
- Furniture, bedding, lighting, signs, prefab buildings: $67.2 billion (2.8%)
- Gems, precious metals: $60 billion (2.5%)
- Plastics, plastic articles: $54.9 billion (2.3%)
- Organic chemicals: $46.1 billion (1.9%)
2007:
3. International Comparisons
Which countries export the most?
Total Exports: % of World
2009
2006
2011
- China 10.2%
- US 8%
- Germany 8%
- Japan 4.5%
- Netherlands 3.5%
- France 3.2%
- South Korea 2.5%
- Italy 2.4%
2016: https://www.worldatlas.com/articles/exports-by-country-20-largest-exporting-countries.html
2017: https://www.statista.com/statistics/264623/leading-export-countries-worldwide/
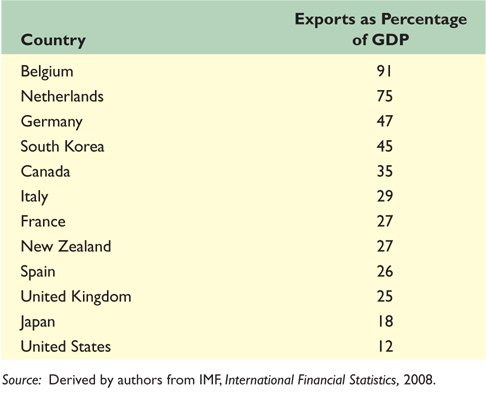
Exports as a Percentage of GDP
2008
2011
- Belgium 82%
- Netherlands 81%
- Germany 50%
- United Kingdom 32%
- Canada 31%
- Spain 30%
- New Zealand 30%
- Itasly 29%
- France 28%
- Japan 18%
- US 14%
2016: https://www.theglobaleconomy.com/rankings/Exports/
How can exports be more than 100% of its GDP?
The US leads the world in the combined volume of exports AND imports.
Summary:
Major Exporters:
- US
- Western Europe
- Japan
- China
New Participants in International Trade
- China and Hong Kong
- Singapore, South Korea, Taiwan
(combined export more than France, Britain, or Italy)- also Malaysia and Indonesia
- Eastern Europe (Poland, Hungary, Czech republic)
- maybe Russia
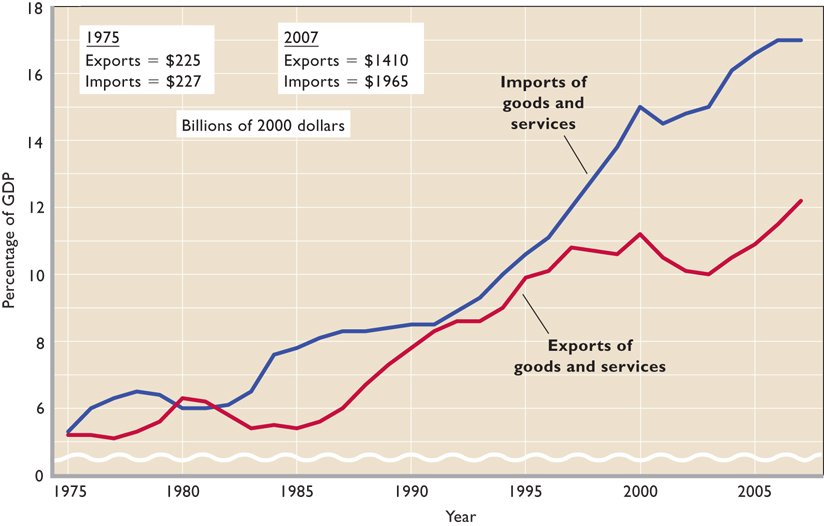
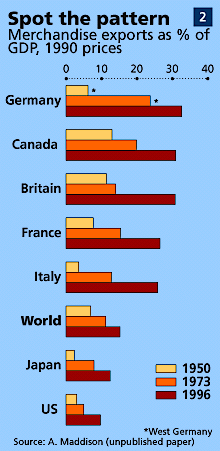
4. Growth of Trade
a. US trade as a percentage of GDP
(note the trade deficit)
b. Why has trade increased?
(1) Improvments in transportation technology ( Costs)
(2) Improved Communications Technolgy (internet)
(3) General Decline in Tariffs (Structural Adjustment)
C. Trade Barriers1. Trade Restriction Preview Quiz - Yellow Page2. Types of trade barriers
a. tariffs1) revenue tariffs
2) protective tariffsb. import quotas
c. nontariff barriersd. voluntary export restrictions
e. export subsidies ( a barrier to trade?)
http://www.bbc.co.uk/news/world-africa-11753215
Global Trade Talks Aim to Reduce Agriculture Subsidies
http://www.npr.org/templates/story/story.php?storyId=853690by Kathleen Schalch
All Things Considered, November 22, 2002 · In Doha, Qatar, World Trade Organization talks focus on dramatically reducing or eliminating agriculture subsidies. Some analysts say subsidies make it difficult for developing countries to compete in growing and exporting crops. NPR's Kathleen Schalch reports.
3. Why trade barriers exist -- the special-interest effect
We now know that "Specialization according to comparative advantage results in a more efficient allocation of the world's resources, and larger outputs ...."If this is true, why do countries restrict trade?
ASSUME: a tariff on imported STEEL:
a. who gains from this trade barrier?
b. who loses from this trade barrier?
c. why do trade barriers "look good"? - the special-interest effect
[http://www.cnn.com/ALLPOLITICS/time/1999/12/06/free.trade.html]4. The effects of trade barriers
a. costs to society - the net costs of trade protection in 8 industries:
From McConnell and Brue, 2002
Industry
Annual loss to economy from barriers = Cost
Net employment loss if barrier is removed = jobs "saved"
Annual cost PER JOB SAVED
Textile and apparel
$ 10.04 billion
55,000
$ 182,545
Maritime transport
$ 2.79 billion
2,450
$ 1,138,775
Dairy
$ 1.01 billion
2,083
$ 484,878
Motor vehicles
$ 710 million
3,400
$ 208,824
Sugar
$ 661 million
1,694
$ 390,200
Meat
$ 185 million
100
$ 1,850,000
Steel mills
$ 162 million
1,265
$ 128,063
Nonrubber footwear
$ 147 million
1,316
$ 111,702
Source: compiled from United States International Trade Commission data released December 1995. Data are for 1993
Also see (1986):
"The gains which trade barriers create for protected industries and their workers come at the expense of much greater losses for the entire economy. The result is economic (productive) inefficiency, reduced consumption an lower standards of living"
(McConnell, Brue, and Flynn 2012, 19th ed., p. 414)
D. The Case FOR Protection (Trade Restrictions)
1. Arguments for trade restrictionsa. Military Self-Sufficiency
b. Increase Domestic Employment
c. Diversification-for-Stability
d. Infant Industry
e. Protection Against Dumping
f. Cheap Foreign Labor2. Military Self-Sufficiency Argument
a. argument:
b. argument makes some economic sense, BUT:
c. counterargument:(1) difficult to measure benefits
(2) many industries make this claim
(3) are there better ways, like subsidies?3. Increase Domestic Employment?
a. argument:
b. counterargument:(1) job creation from imports also
(2) retaliation
(3) long-run feedbacks(a) must import to export
(b) jobs change, but not increasedc. argument does not make economic sense
d. Moving toward free trade will CHANGE the jobs in an economy but freer trade doesn't create jobs or reduce jobs.
See this short news report from 2011 when the US ratified free trade aggreements (with Panama, South Korea, and Colombia:
http://www.npr.org/2011/10/12/141264928/will-free-trade-agreements-really-create-jobs4. Infant-Industry Argument
a. argument:(1) temporary protection
(2) new industries become established
(3) protection then removed
(4) argument makes some economic sense, BUT:b. counterarguments
(1) which industries?
(2) temporary?
(3) Is it necessary?
(4) better methods-subsidies?c. strategic trade policy - modified infant industry
(1) infant industries in industrialized economies ?
(2) promotes product development by reducing risk
(3) examples: Japan; South Korea
(4) problems: retaliation5. Diversification for Stability
a. argument:(1) protect certain industries to diversify economy
(2) less dependence on one or two products
(3) argument makes some economic sense, BUT:b. counterargument:
(1) doesn't apply to advanced economies
(2) high costs: inefficiency6. Protection Against "Dumping"
a. argument:(1) define dumping: below COST
(2) driving out competitors = monopolization and allocative inefficiency
(3) argument makes some economic sense, BUT:b. counterargument:
(1) few cases
(2) is price discrimination dumping?
(3) dumping or comparative advantage?7. Cheap Foreign Labor
a. argument: to protect higher paid workers in developed countries from competition of lower paid workers in the less developed countriesb: counterargument
(1) therefore rich countries cannot trade with poor countries?
(2) comparative advantage, not absolute advantage
(3) trade restrictions will make workers in both countries worse off
c. argument does not make economic sense
Summing Up1. Arguments that make some sense, but often abuseda. Military Self-Sufficiency
b. Diversification
c. Infant Industry
d. Protection from Dumping2. Arguments that do not make sense, but are very popular
a. increase domestic employment
b. cheap foreign labor
E. Multilateral Trade Agreements and Free-Trade Zones
1. Reducing Trade Barriersa. G.A.T.T. (1947-2005)b. W. T. O
(1) 153 countries(2) Doha Round of negotiations
(a) reduce tariffs and quotas worldwide
(b) promote trade in services
(c) reduce Agricultural subsidies
(d) protect intellectual property rights
2. Free Trade Zones / Other Trade Agreements
a. European Unionb. NAFTA
c. CAFTA-DR
d. others
- Mercosur
- Caricom
- FTAA ?
- Panama, South Korea, Colombia: http://www.npr.org/2011/10/12/141264928/will-free-trade-agreements-really-create-jobs
- TPP - TransPacific Partnership - http://www.cnn.com/2011/11/12/politics/obama-apec/
3. Offshoring of Jobs
F. Exchange Rates
- What is a "weak dollar"?
- The dollar depreciates if:
- Before: $1 = 100 Yen
- Now: $1 = 90 Yen
Effects of a "weak dollar"
- US exports are cheaper and therefore increase
- US imports are more expensive and therefore decrease
- RESULT: the US trade deficit decreases
- What causes the value of currency to change?
- An increase in demand for the dollar by foreigners will cause it to appreciate:
- This would happen if foreigners want more US products
- eg. change in tastes for US products
- eg. increased incomes of foreigners
- This would happen if foreigners want to make more financial investments in the US
- eg. if US interest rates were high
NOTE: if the US wanted to make the dollar "stronger" the Fed could raise interest rates. Would that be a good idea now?
- An increase in supply of the dollar will cause it to depreciate
- This would happen if Americans want more foreign products
- eg. change in tastes for foreign products
- eg. increased incomes of Americans
NOTE: if the US wanted to make the dollar "stronger" in could undertake policies to make Americans more poor.
- This would happen if American wanted to make more financial investments in foreign countries
- eg. if foreign interest rates were high
- Txtbook: Determnants of Demand and Supply of Foreign Exchange
[Be able to use a supply and demand model to illustrate why exchange rates change.]
- Change in tastes
- Change in relative incomes
- Change in relative inflation rates (prices)
- Change in relative interest rates
- Change in expected rates of returns on other financial investments
- OPTIONAL:
- Weak dollar 101
Low dollar affects everything from mortgage rates to consumer prices to the job market. Here's how.
G. Trade Deficits
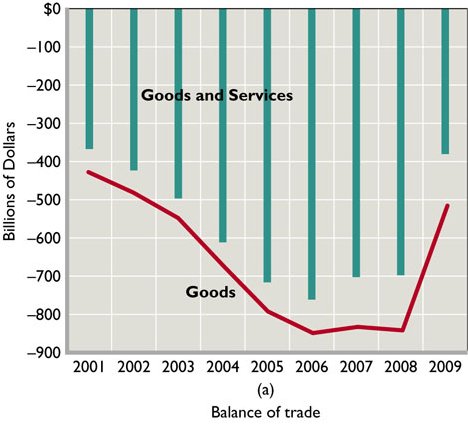
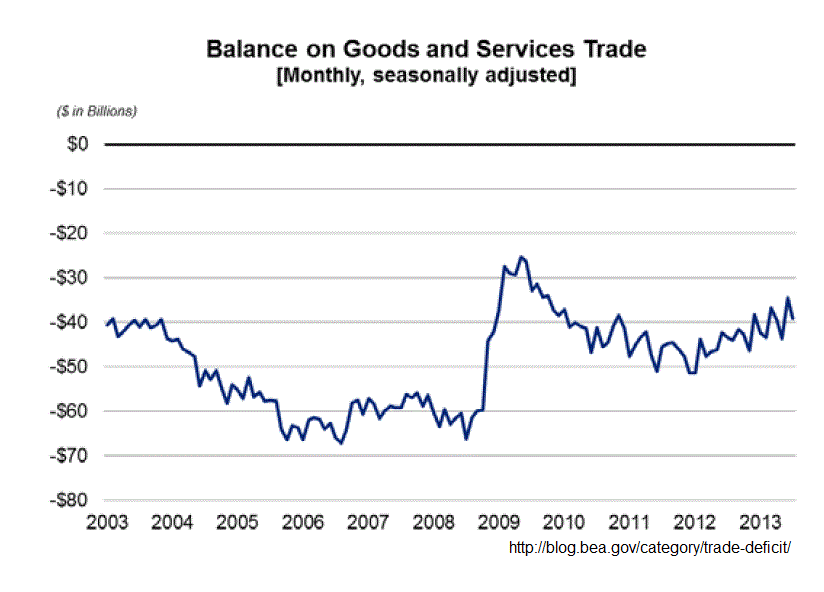
1. recent U.S. trade deficits - annuala. goods only2000-2017:
https://www.statista.com/statistics/220041/total-value-of-us-trade-balance-since-2000/b. goods AND services
2. CAUSES of the trade deficits
a. growing trade deficits between 2002 and 2007:1. more rapid economic growth (increased incomes) in the U.S. than its trading partners (2001-2007) wjile many of our trading partners had slow growth or recessions2. new large trade deficits with China
- the US is China's largest export market
- China's comparative low standard of living limits imports from the US
- Chinese currency is fixed therefore the large trade surplus with the US has not caused its currency to appreciate very much (See from 6/10/2011: http://www.npr.org/2011/10/06/141097564/bipartisan-support-for-china-tariffs-ahead-of-vote
3. rapid rise in the price of oil and large oil imports therefore continuing trade deficits with oil-exporting countries
4. declining savings rate in the US up to the recession of 2007-2009.
5. desire by foreigners to purchase US financial assets keeping he value of the dollar high
b.Why did it decrease between 2007 and 2009?
1. US recession (decrease in incomes) decreases purchases of imports2. rising savings rates in the US after the collapse of the housing market decreases the demand for imports
From the 1950s to the 1980s the savings rate was typically 8-10%, rising as high as 12% in recessionary times. Then it dropped, reaching about 1% from 2005 on, and occasionally even went negative. But in November the savings rate grew to 2.8%, economists are projecting it to be 3-5% in 2009 (Goldman's projecting it to reach 6-10%)
[http://www.huffingtonpost.com/penny-herscher/will-the-rising-personal_b_157526.html]c. Increase in the trade deficit beginning in 2009: Economic growth again
3. implications of a trade deficit
a. increased current domestic consumption (we are consuming more)b. increased U.S. indebtedness (Where do we get the foreign currency to buy imports?)
- we can borrow if from foreigners
- or sell assets to foreigners