|
|
|
1a - Day One |

1a - Day One
OUTLINE -- Lesson 1a
Limits, Alternatives, and Choices: What is Economics and what are the
5Es,
(You can find parts of this lecture online at: http://www.harpercollege.edu/mhealy/eco212i/lectures/ch1-18.htm
)
|
REVIEW: |
I. Answer the following:
Use the clicker to answer the following question:QUESTION:
Assume that a hurricane has struck the coast of Florida causing massive destruction. As a result, the prices of many products like hotel rooms, water, plywood, etc. increase significantly. For example, let's say the price of plywood increases from a price of $10 a sheet before the hurricane to $30 a sheet after the hurricane.To help the people of Florida, should the Florida government pass a law keeping the price of these products (like plywood) to their levels before the hurricane struck? OR What should the government do, if anything?
USE CLICKERS:
A. Pass law keeeping prices low (at their pre-hurricane level)B. Let prices increase (do nothing about prices)
GOAL OF ECONOMICS: Maximize Society's satisfaction
II. Introduction to ECO 211 - Day 1
Microeconomics,
by McConnell, Brue, and Flynn, 20th edition, McGraw-Hill,
2015 Tomlinson Videos on
ThinkWell BUYING the
Tomlinson Videos on ThinkWell USING the Tomlinson
Videos on Thinkwell: The Yellow Pages
are packet of worksheets We will do most of the
graphing exercises in class and some of the Quick
Quizzes. You will not get points for doing them, but I
think you will find them very useful while you prepare
for the quizzes and exams. The Yellow Pages will be
distributed, for free, in class. They are also available
on our Blackboard site. The ANSWERS to all Yellow Pages
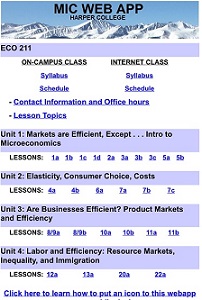
can also be found on our Blackboard site. MIC WEB
APP: The MicWebApp
has all of the information found on our LESSONS
page. How to put an icon to the
app on the homescreen of your mobile device: The app is not designed
to replace your textbook, computer, or paper and pencil.
To learn the class material you will have to read the
textbook, watch the Tomlinson video lectures, and DO
PROBLEMS. When doing problems you will need to use pencil
and paper. The app is designed to introduce you to the lesson
topic and show you what you need to learn. It
will also help you do a quick review after you have
studied the material. The app is organized
according our twenty-six lessons. For each lesson you
will usually find a quick introduction, an interesting
topic, the reading and video assignments, key term
flashcards, a quick review quiz, key graphs, and YouTube
review videos.
REQUIRED:
Just the textbook. No textbook access codes. No
"Connect".
NOTE: We will be using the 20th edition
even though there is a 21st edition available. (You may
use the 19th edition.)
REQUIRED:

REQUIRED:
VERY
USEFUL:
Be sure to put an icon
to the app on your mobile devices !!!
Blackboard Instructions:
- "Economics is . . . . "
TEXTBOOK'S DEFINITION : Economics is the social science concerned with how individuals, institutions, and society make optimal (best) choices under conditions of scarcity.
GOAL OF ECONOMICS: BEST (optimal) CHOICES = Maximize Satisfaction !
OUR DEFINITION: Economics is the social science
that studies how we choose to use limited
resources to obtain the maximum satisfaction of
unlimited human wants
B. What is MICROECONOMICS ?
Companies merge: http://www.usdoj.gov/opa/pr/1997/January97/003at.htm
2. Macroeconomics News:
Economic Growth and Inflation: http://money.cnn.com/2005/01/13/commentary/column_hays/hays/index.htm
3. MICROECONOMICS studies the INDIVIDUAL parts of an economy:
- individual industries, products and businesses
- for example:
- What is the price of a lift ticket?
- Why does the price of plywood increase?
- Why are wages increasing?
- What are the effects of Vail Resorts buying Keystone and Breckenridge ski resorts?
- Why did Motorola lay off 2000 workers in Harvard, IL?
- some believe microeconomic principles form the foundation of economic theory.
4. MACROECONOMICS studies the economy as a whole:
- unemployment
- inflation
- economic growth
5. EXAMPLES of issues in economics: Micro or Macro?
GOAL OF ECONOMICS: Maximize Society's Satisfaction !
1. ACTIVITY: In your notebook, write YOUR definition of efficiency."Efficiency is . . . . "
2. IS EFFICIENCY . . . .
a. Is EFFICIENCY the same as economic growth ?
b. Is EFFICIENCY using as few resources as possible when producing a product ?
c. Is EFFICIENCY using resources to produce more CDs that people want and fewer cassette tapes that they don't want ?
d. Is EFFICIENCY using all of our resources (full employment) ?
e. Is EFFICIENCY a fair distribution of products ?
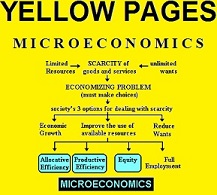
D. "EFFICIENCY" vs. the "5Es"
- GOAL OF THE ECONOMY: to maximize society's satisfaction
- "Efficiency" helps do this, but it is a vague concept
- The 5 Es are five ways to maximize society's satisfaction:
- Economic growth
an increase in our ABILITY to produce
- Productive Efficiency:
using as few resources as possible when producing a product
- Allocative Efficiency:
using resources to produce more CDs that people want and fewer cassette tapes that they don't want
- Full Employment:
using all of our resources
- Equity:
a fair distribution of products1. Natural disasters and "price-gouging"
- Gouging complaints 'rampant'
- But: http://mises.org/daily/1593/ /
- Is it GOOD for the citizens of Florida if the price of plywood increases from $20 to $60 after a hurricane?
- Remember, the goal is to maximize society's satisfaction, (i.e. get them plywood)
2. Coca-Cola Lays off 6000
- read
- Are these lay offs GOOD for society?
- Remember, the goal is to maximize society's satisfaction (i.e. produce more things)
- Not all layoffs are good for society
3. Are gasoline prices TOO LOW?
- Remember the goal is to achieve the 5 Es in order to maximize society's satisfaction
- International comparisons:
- Why?
1b - The 5Es of Economics |
VI. The Economic Perspective: Scarcity and Choice [5 Es ]
A. Microeconomics - The study of making choicesB. Scarcity -- Limited resources and Unlimited wants
The reason why we have to make choices
- definitions in economics are sometimes different - define "scarcity"
- "erskinite"
B. The necessity of choice - we must make choices = the economizing problem
C. options for dealing with scarcity
[This is NOT the same as the common defintion: an increase in output]b. caused by:
- MORE resources
- better resources
- better technology
c. textbook: "An outward shift in the production possibilities curve which results from an increase in resource quantity or quality or an improvement in technology" (more on this later)
2. Reducing wants
3. Use existing resources wisely = maximizing satisfaction
VII. Maximizing Satisfaction -- 5Es
- four more Es
The goal of our
decision-making
A. Productive Efficiency1. definition: producing at a minimum cost2. Prod. Efficiency. and Scarcity:
By producing at a minimum cost, FEWER RESOURCES are used and MORE can be produced3. HOW?
a. not using more resources than necessary
b. using resources where they are best suited
c. using appropriate technology4. Examples
a. Productive Efficiency: not using more resources than necessary(1) How does this MAXIMIZE SOCIETY'S SATISFACTION?(a) What happens to the amount produced?
(b) price(2) Examples:
(a) Janitors at Harper
(b) Grocery stores: USSR
(c) Motorola/Sears/AT&T/etc. lay off 1,000s
- 1000s LAID OFF: Coca-Cola Lays off 6000
- Not all layoffs are good for society
b. Productive Efficiency: using resources where they are best suited
(1) How does this MAXIMIZE SOCIETY'S SATISFACTION?(a) what happens to the amount produced?
(b) price(2) Examples:
(a) secretaries/truck drivers
(b) doctors/engineers
(c) IL-corn/Alabama-cotton
(d) ND-potatoes/Honduras-sugar
(e) free trade(f) discrimination
c. Productive Efficiency: using appropriate technology
(1) What is appropriate?(a) appropriate = min. cost
(b) best technology?(2) How does this MAXIMIZE SOCIETY'S SATISFACTION?
(a) What happens to the amount produced?
(b) price(3) Examples:
(a) farming: US/Kenya
(b) farming: tractors/helicopter
(c) Chicago/Beijing airport
(d) Other1. definitionusing our limited resources to produce:
- THE RIGHT MIX OF GOODS = the goods that maximizes society's satisfaction
- MORE OF WHAT PEOPLE WANT
- LESS OF WHAT PEOPLE DON'T WANT
2. How does this MAXIMIZE SOCIETY'S SATISFACTION and REDUCE SCARCITY?
3. examples
a. steel: horseshoes or cars?
b. crude oil: gasoline or kerosene?
c. small cars or SUVs?4. Allocative inefficiency
a. producing TOO LITTLE or TOO MUCH
shortages and surpluses
b. How does allocative inefficiency affect scarcity (maximizing society's satisfaction)?
c. examples:
(1) US agriculture: SURPLUS - mountains of grain
(2) SHORTAGE - long lines in Poland
(3) SHORTAGE - Super bowl tickets
(4) Natural disasters: "price-gouging" prevents SHORTAGES
- http://netra.sptimes.com/Weather/92698/Gouging_complaints__r.html
- http://www.sptimes.com/Weather/92598/Pinellas_put_on_price.html
(5) food price controls cause SHORTAGESZ
(6) gasoline
(a) price controls during W.W.II
(b) price controls int the 1970s: Arab oil embargo
(c) no price controls during Gulf Warsc. WHAT CAN BE DONE to prevent allocative inefficiency (prevent shortages and surpluses)?
5. The role of PRICES in achieving allocative efficiency
a. What is a shortage?
Textbook definition: The amount by which the quantity demanded of a product exceeds the quantity supplied at a particular (below-equilibrium) price.
Are these really shortages?
b. What causes shortages?
(1) gasoline shortages:
- WWII,
- 1970s
- Gulf Wars? (no shortages)
(2) Super Bowl tickets and scalpers
(3) food price controls and famine
c. Prices are very important in achieving allocative efficiency.
- Allocative inefficiency is usually caused by the price being too high (creating a surplus) or too low (creating a shortage).
- In lesson 3a, 3b, and 3c 3 we will study how a market economy results in prices that usually achieve allocative efficiency.
- In lesson 5a we will study how the government sometimes interferes with prices and causes allocative inefficiency (price ceilings and price floors). This means that the government causes more scarcity and reduces society's satisfaction.
- Also in lessons 5a and 5b we will study examples of when the market does NOT get the price right and then the government may interfere, changing product prices, in order to achieve allocative efficiency and increase society's satisfaction (negative externalities and positive externalities).
- Why is the price of gasoline in the United States TOO LOW ?"
- To achieve allocative efficiency in a market economy like that of the United States, the price has to be "right".
1. definition: a "fair" distribution of income, or goods and services
2. Equity vs. Equality
3. examplesa. US:
b. World:
4. How does equity help society achieve the maximum possible satisfaction from its limited resources?
a. President Trump example
b. the role of Diminishing Marginal Utility1. definition: using ALL available resources2. Examples
a. labor: FE = about 5% unemploymentb. capital utilization rate: FE = about 85%
c. land
d. entrepreneurial ability
3. How does full employment help society achieve the maximum satisfaction from its limited resources?
1c - Scarcity and Budget Lines
A. DEFINITION:
- TEXTBOOK'S DEFINITION : Economics is the social science concerned with how individuals, institutions, and society make optimal (best) choices under conditions of scarcity.
- What I like: The emphasis on making CHOICES
- What is unclear: What does "SCARCITY" mean?
- GOAL OF ECONOMICS: BEST CHOICES = Maximize Satisfaction !
- OUR DEFINITION: Economics is the social science that studieshow we choose to use limited resources to obtain the maximum satisfaction of unlimited human wants
B. Our definition has 4 parts:
- "social science"
- choice
- scarcity
- maximizing satisfaction
IV. "Social Science" -- Using theories / MODELS: An economic model is a simplified description of reality
A. based on facts
B. simplifications
C. generalizations
D. abstractions
E. ceteris paribus
VIII. Limited Resources: The Four Factors of Production
A. What is a resource?B. Types of Resources
1. Landa. examples
b. definition2. Capital
a. examples
b. definition3. Labor
a. examples
b. definition4. Entrepreneurial Ability
a. examples
b. definition
A. Demonstrating economic concepts
B. Line Graphs1. construction
2. inverse and direct relationships
3. slopea. linear (straight) graph
b. nonlinear (bent) graph
The Economizing Problem: Making Choices
BRIEF OUTLINE: The Necessity of Choice / Making Choices
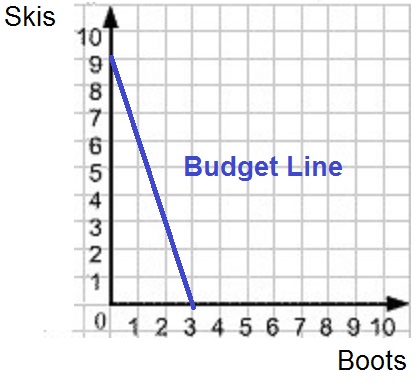
I. Individual's Economizing Problem: The Budget Line
1. Unlimited Wants
2. Limited resources

1d - Production Possibilities and
Benefit-Cost Analysis
II. Society's Economizing Problem: Production Possibilities
A. The Economizing Problem -- The Necessity of ChoiceTextbook definition: The choices necessitated because society’s material wants for goods and services are unlimited but the resources available to satisfy these wants are limited.1. Unlimited Wants
2. Limited resources
B. Production Possibilities -- Demonstrating the Necessity of Choice for Society
1. Production Possibilities Table (see yellow page)a. shows the MAXIMUM POSSIBLE LEVELS OF PRODUCTION given the assumptions
b. assumptions1) fixed resources
2) fixed technology
3) productive efficiency
4) full employment
5) only two goodsc. the necessity of choice -- Unattainable combinations (or we can't have everything that we want)
2. Production Possibilities Curve
The Production Possibilities Curve can be use to illustrate several important economic concepts:
- we must make choices
- choices have opportunity costs
- the law of increasing costs (the cost of having ONE more of something increases as you have more)
- the effect of unemployment
- the effect of productive inefficiency
- the effect of economic growth
- how present choices affect future possibilities
- it does NOT show the optimum product mix (allocative efficiency)
a. the necessity of choice -- Unattainable combinations
b. opportunity costs1) ALL costs in economics are opportunity costs
2) definition: the amount of other products which must be forgone or sacrificed to produce a unit of a product.3) examples
- op. cost of coming to class today
- op. cost of attending NIU
- op. cost of a free trip to Europe
- What is the op. cost of a human life?
4) calculating opportunity costs
c. law of increasing costs
1) definitionAs the production of a good increases the opportunity cost of producing an additional unit rises.
2) shape of the PPC -- concave
3) rationaled. unemployment
e. productive inefficiency
f. economic growth1) definition(a) Our Definition: an increase in the ABILITY to produce goods and services(b) Textbook's definition: An outward shift in the production possibilities curve which results from an increase in resource quantity or quality or an improvement in technology
(c) Common Definition: economic growth occurs when the economy produces more
2) causes
- getting more (additional) resources
- getting better resources
- getting new, better, technology
3) graphically
4) "ABILITY" vs. how much is actually produced
5) Is a shrinking PPC? possible?
6) What would cause nonproportional growthg. present choices, future possibilities
h. optimum product mix? (allocative efficiency?)
The Production Possibilities Curve can be use to illustrate several important economic concepts:
- we must make choices
- choices have opportunity costs
- the law of increasing costs
- the effect of unemployment
- the effect of productive inefficiency
- the effect of economic growth
- how present choices affect future possibilities
- it does NOT show the optimum product mix (allocative efficiency)
- later we'll use the MB=MC analysis to do this
1. The economics of War (19th ed. p. 14 / 20th ed. p. 15)
- defense good, civilian goods and the "war on terror"
- Marginal Benefit and Marginal Costs
- 9/11 increase the MB of defense goods
2. discrimination
3. growth: Japan vs. U.S.
4. international trade
A. Benefit-Cost Analysis -- HOW to make good decision?
"the economic perspective")1. definitionthe selection of ALL possible alternatives where the marginal benefits are greater than the marginal costselect all where: MB > MC
up to where: MB = MC
but never where: MB < MCTEXTBOOK: Marginal Analysis: the comparison of marginal ("extra" or "additional") benefits and marginal costs, usually for decision making .
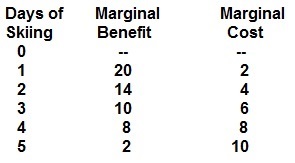
2. marginal benefits and marginal costs
The BEST option is where:
MB = MC
- marginal benefit
The extra (additional) benefit of consuming one more unit of some good or service; the change in total benefit when one more unit is consumed.
- marginal cost
The extra (additional) cost of producing one more unit of output; equal to the change in total cost divided by the change in output (and in the short run to the change in total variable cost divided by the change in output).
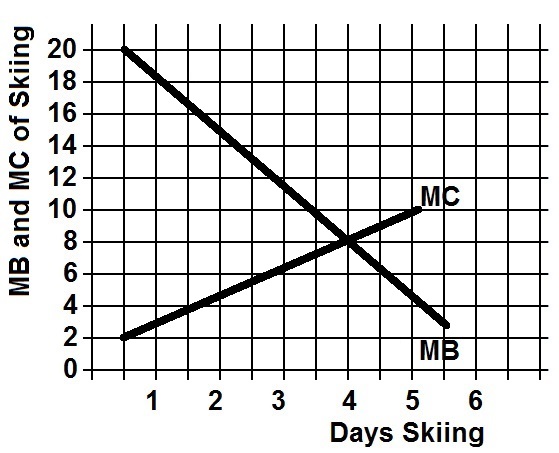
3. Marginal Benefit = Marginal Cost Rule
- MC=MB is the point at which the size or scope of production (or any decision) is optimized. (i.e. the "best" decision)
- The activity, scope, or output of a project (or decision) should be increased until it reaches this point - or comes very close to it.
- This point will yield the maximum net benefit to society.
If marginal benefit exceeds marginal cost, then the project is too small, and could be increased thereby increasing the net benefit to society
if MB > MC, then do more you are doing too little if you do more the extra benefits will be greater than the extra op. cost
If the marginal cost exceeds the marginal benefit, then the project will decrease the net benefit to society and should be decreased in scope.if MB < MC, then do less you are doing too much you are giving up high op. costs for little extra benefit
- For example, if the cost of a proposed government program exceeds its benefits, then it would be unwise to undertake it, but if the benefits exceed the cost, then it would be uneconomical, or "wasteful" not to spend on that government program.
4. ignore fixed or sunk costs
any cost that does not change as a result of the decisionTEXTBOOK: A fixed cost is any cost which in total does not change when the firm changes its output; the cost of fixed resources.
19th edition pp. 158-159, “Last Word: Don't Cry over Sunk Costs - Sunk costs are irrelevant in decision making”
20th edition p. 206 "Ignoring Sunk Costs"Sunk costs are irrelevant in decision making
- buy tickets to football game but wake up with the flu - should you go?
- you buy "totally mushy" apples, should you eat them?
- already paid a nonrefundable annual lease for a business - should you move to a more profitable location
- $1 million spent on R&D for a new product that few people want - should you produce it anyway even at a loss?
- New Coke
- McLean
- Pfizer's insulin inhaler
- you already bought the ring - should you therefore marry him/her?
5. Changes in MC and MB
- if MC INCREASE then people will do LESS
- if MC DECREASE then people will do MORE
- in MB INCREASE people will do MORE
- if MB DECREASE people will do LESS
6. examples
a. How many guards should be hired?
b. How many bridges should be built?
c. Should I go to class today?
d. should I attend NIU full time?
e. Should I drive fast?
f. The economics of War (p. 13)
- defense good, civilian goods and the "war on terror"
- Marginal Benefit and Marginal Costs
- 9/11 increase the MB of defense goods
g. "Sunk costs are irrelevant in decision making"
- buy tickets to football game but wake up with the flu - should you go?
- you buy "totally mushy" apples, should you eat them anyway?
- already paid a nonrefundable annual lease for a business - should you stay there (or move to a more profitable location)
- $1 million spent on R&D for a new product that few people want - should you produce it anyway even at a loss?
- Pfizer's insulin inhaler
- New Coke
- McLean
- you already bought the ring - should you therefore marry him/her?
i. Others
Think of a decision that you currently have to make. What are the marginal benefits and the marginal costs? Are there any sunk costs that do not matter?5. GRAPHICALLY
B. Microeconomic Applications
1. optimal quantity of a good: MSB = MSC2. utility maximizing rule: MUa/Pa = MU b/Pb (Lesson 6a)
3. profit maximization: MR = MC (lessons 8/9a, 10a, 11aq, 11b)
4. rule for employing resources: MRP = MRC (lessons 12a, 13a)
C. REVIEW: Multiple Choice Problems
REVIEW
Specify and explain the typical shapes of the marginal-benefit and marginal-cost curves. How are these curves used to determine the optimal allocation of resources to a particular product. If current output is such that marginal cost exceeds marginal benefit, should more or fewer resources be allocated to this product? Explain.ANSWER: The marginal benefit curve is downward sloping, MB falls as more of a product is consumed because additional units of a good yield less satisfaction than previous units. The marginal cost curve is upward sloping, MC increases as more of a product is produced since additional units require the use of increasingly unsuitable resource. The optimal amount of a particular product occurs where MB equals MC. If MC exceeds MB, fewer resources should be allocated to this use. The resources are more valuable in some alternative use (as reflected in the higher MC) than in this use (as reflected in the lower MB).
Multiple Choice Problems
The following data are for a series of increasingly extensive flood control projects:
Total cost
per yearMC Total benefit
per yearMB No project
$ 0
------------ $ 0
------------ Plan A
levees
10,000
20,000
Plan B
small reservoir
24,000
34,000
Plan C
medium reservoir
44,000
42,000
Plan D
large reservoir
72,000
40,000
1. Refer to the above data. For Plan D marginal costs and marginal benefits are:
A. $72,000 and $64,000 respectively.B. $28,000 and $2,000 respectively.
C. $24,000 and $18,000 respectively.
D. $16,000 and $28,000 respectively.
2. Refer to the above data. On the basis of benefit-cost (marginal) analysis government should:
A. undertake Plan A.B. undertake Plan B.
C. undertake Plan C.
D. undertake Plan D.
3. Plan C above entails:
A. marginal benefits in excess of marginal costs.B. fewer spillovers than either Plan A or Plan B.
C. an overallocation (too much) of resources to flood control
D. an underallocation (too little) of resources to flood control.
(See answers below)
ANSWERS:
Total cost
per yearMC Total benefit
per yearMB No project
$ 0
-- $ 0
-- Plan A
levees
10,000
10,000
20,000
20,000
Plan B
small reservoir
24,000
14,000
34,000
14,000
Plan C
medium reservoir
44,000
20,000
42,000
8,000
Plan D
large reservoir
72,000
28,000
40,000
2,000
1. For Plan D marginal costs and marginal benefits are:
B. $28,000 and $2,000 respectively.Be sure that you can calculate MB and MC. If you need help ask on the Discussion Board
2. Refer to the above data. On the basis of benefit-cost (marginal) analysis government should:
B. undertake Plan B.Do all options as long as the MB are greater then the MC (MB>MC)
3. Plan C above entails:
C. an overallocation (too much) of resources to flood controlFor plan C the MB are less than the MC (MB<MC). this means tat too many resources are being used on these flood control projects. To zsay this another way, IF the MB are less than the MC it means that you have other uses for these resources that will give you more benefits. Remember, the MC of any decision is the benefits of other alternatives that you are not doing.
