ECO 212 ONLINE! - QUIZ 2 - Supply and Demand
To get the answers SCROLL TO THE BOTTOM.
1.
When one speaks of "demand" in a particular market, this refers to:
A.
the quantity demanded at a given price.
B.
only one price-quantity combination on the demand schedule.
C.
only one point on the entire demand curve.
D.
the whole demand curve.
2.
The table below shows the market demand for a bushel of wheat in a market where there are just three buyers (data are hypothetical).
Price
Qd 1
$6
7
5
9
4
15
3
21
Qd 2
10
Qd 3
6
8
12
16
R-1 REF 3-22 (REF03018)
Refer to the above table. At a price of $6, the market demand for bushels of wheat among the three buyers in the market is:
17.
24.
37.
49.
3.
A normal good is one:
which all people like.
which all normal people like.
for which demand increases when price decreases.
for which demand increases when income increases.
4.
R-2 REF 3-41 (F03036)
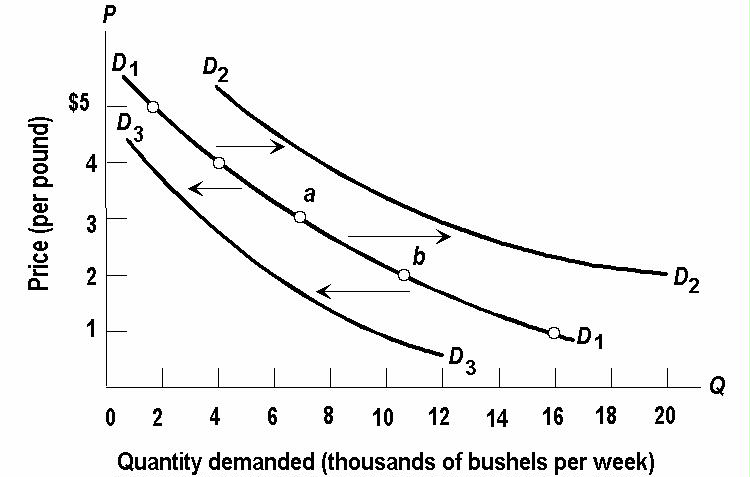
Refer to the above diagram, which shows three demand curves for coffee. Which of the following would cause the change in the demand for coffee illustrated by the shift from D1 to D2?
a decrease in the price of tea
an increase in consumer incomes
an increase in the price of sugar
a technological improvement in the production of coffee
5.
R-3 REF 3-103 (F03094)
Refer to the above diagram, which shows three supply curves for corn. Which of the following would cause the change in the supply of corn illustrated by the shift from S1 to S 3?
a decrease in the price of fertilizer
an increase in the price of irrigation equipment
a change in consumer tastes in favor of cornbread
6.
R-4 REF 3-126 (F03113)
Refer to the above diagram. The equilibrium price and quantity for milk in this market are:
$1.50 and 28 million gallons.
$1.50 and 30 million gallons.
$2.00 and 20 million gallons.
$1.00 and 35 million gallons.
7.
Refer to the above diagram. If the price were $2 per gallon, there would be a:
shortage of 8 million gallons.
shortage of 10 million gallons.
surplus of 10 million gallons.
surplus of 8 million gallons.
8.
R-5 REF 3-174 (F03153)
If peanut butter and grape jelly are complementary products, which diagram above illustrates the effect in the peanut butter market of a decrease in the price of grape jelly?
A
B
C
D
9.
Which diagram above illustrates the effects on the peanut butter market of a higher wage rate for peanut workers?
10.
A television station reports that the price of orange juice has declined but the quantity sold has increased. This situation would be caused by a(n):
increase in demand.
increase in supply.
decrease in demand.
decrease in supply