Structural Adjustment Policies
In our lecture on Structural Adjustment we discussed various policies that countries are adopting all around the word to promote economic growth (increasing output rather than increasing their ability) and achieve productive and allocative efficiency.
Structural Adjustment Policies
1. Privatization
2. Promotion of Competition
3. Limited and Reoriented Role for Government
4. Price Reform: Removing Controls
5. Joining the World Economy
6. Macroeconomic Stability
Even though the concepts of SUPPLY and DEMAND are microeconomic concepts, they are reviewed in this macroeconomics course because not all students have taken microeconomics (ECO 211) and they are fundamental principles that all economic student should master. We will study supply and demand in this "Macroeconomics of the Global Economy" course to better understand why there is a worldwide movement to remove price controls and let Supply and Demand determine prices.
In a capitalist economy, prices are very important. They have two fundamental functions:
By doing this they help the economy maintain allocative efficiency and productive efficiency.
In the 5Es lesson on allocative efficiency we discussed that it was good for the price of plywood to increase in Florida after a hurricane. When the price increased two things happened: (1) plywood was rationed to its most important uses (not doghouses or decks), and (2) the high prices were an incentive for more plywood to be guided to Florida so that they had more plywood. If the price of plywood was kept too low the result was allocative inefficiency (a shortage).
Prices are also very important in maintaining productive efficiency. In the 5Es lecture on Productive efficiency we defined it as producing at a minimum cost. In order to minimize costs, producers must know the prices of the resources. If these resource prices are determined by demand and supply then they will reflect the relative scarcity of the resources and their relative importance (more scarce and important resources will have a higher price) and the economy can achieve productive efficiency.
In a capitalist society prices are determined by the interaction of demand and supply. Since prices are so important, we need to better understand how they are determined. Why is the price of gasoline $2.09 a gallon. Why does a candy bar cost $0.75? Why is the price of plywood normally $10 a sheet, but $30 a sheet after a hurricane?
This chapter focuses on competitive markets. A market, as introduced in Chapter 2, is an institution or mechanism that brings together buyers (demanders) and sellers (suppliers) of particular goods and services. Competitive markets have:
1. a large number of independent buyers and sellers.
2. standardized goods.
3. prices that are "discovered" through the interaction of buyers and sellers. No individual can dictate the market price.
In a competitive market (i.e. pure capitalism) product prices are determined through the interaction of DEMAND and SUPPLY.
If the price of a product increases what happens to demand for that product? For example, If the price of pizza increases, then the demand for pizza does what?
-
-
-
-
-
-
-
NOTHING! If the price of pizza increases, the demand for pizza does not change. This is because in economics we have a more precise, and different, definition of demand. In economics, demand is NOT the quantity that people buy.
DEFINITION: So what is demand?
Demand is a schedule that shows the various quantities that consumers are willing and able to buy at various prices in a given time period, ceteris paribus. We should look more closely at this definition.
Demand is a table of numbers (schedule). Look at the table below. The whole table might represent my demand for pizza because it shows the quantities that I am willing an able to buy at different prices. It does not tell how much I do buy.
Demand Schedule and Curve
As we learned in a previous lesson, any point on a graph represents two numbers, so we can plot our demand table as in the graph below.
If we assume that there are quantities and prices in-between those in the table (for example if the price was $4.50 how many pizzas would I buy?) we can connect the points and we get the demand curve (graph).
This is my demand for pizza. This demand curve does NOT tell us what the price will be. To know what the price will be we need both demand and supply.
But we can see what happens to demand if the price of pizzas increases. If the price of pizza increases, say from $6 to $9, nothing on the table changes (demand does not change) because demand already includes various prices and various quantities. Demand (the whole table or the graph) does not change when the price changes because demand INCLUDES various prices and various quantities. Demand is NOT how much we buy.
Note that our definition of demand includes the ceteris paribus assumption. When we develop a demand curve only the price and quantity demanded change. Everything else is assumed to remain constant. I don't get a large increase in my income. I don't win the lottery. There isn't a new study out that states pizzas cause cancer. All other factors remain the same - only the price and quantity demanded change.
Law of Demand
As we can see on the demand graph, there is an inverse relationship between price and quantity demanded. Economists call this the Law of Demand. If the price goes up, the quantity demanded goes down (but demand itself stays the same). If the price decreases, quantity demanded increases. This is the Law of Demand. On a graph, an inverse relationship is represented by a downward sloping line from left to right.
Why?
Why is the law of demand true? Why is the demand curve downward sloping from left to right? Why do people buy more at lower prices and less at higher prices?
As social scientists, economists try to explain human behavior. It is common sense that people behave this way - but how can we explain it? Economists have three explanations:
Diminishing Marginal Utility
We learned in the 5Es lesson that equity helps reduce scarcity because of the law of diminishing marginal utility. This economic principle also explains why the demand curve is downward sloping.
Utility is the reason we consume a good or service. You might call it satisfaction. I get satisfaction (utility) when I drive my boat. I get utility (satisfaction?) when I go to the dentist or go skiing. "Marginal" means EXTRA or ADDITIONAL. So, according to the law of diminishing marginal utility, the EXTRA (not the total) utility diminishes for each additional unit consumed. If we are receiving less extra utility when we buy one more of a product, we won't be willing to pay the same price. After all, it is the marginal utility that we are paying for.
The first piece of pizza that I consume I really enjoy. It gives me a lot of utility. But after a few pieces, I don't get as much additional satisfaction from one more piece as I did from the first piece. I am beginning to "get sick of it". "Getting "sick of it" is diminishing marginal utility. So, I will only buy a second piece if it has a lower price, since I am getting less additional utility from the second piece. This explains why we buy more ONLY IF the price goes down and why we buy less ONLY IF the price goes up. It explains the law of demand.
Income Effect
Another explanation of why the law of demand explains human behavior is the "income effect". Remember that we are trying to explain why the quantity demanded increases if the price decreases or why the demand curve is downward sloping from left to right.
If the price of price of pizza decreases what happens to your income?
|
|
(NOTE: the "![]() "
means "causes".)
"
means "causes".)
?
Nothing happens to your income when the price of pizza decreases? (Do you get a raise when Pizza Hut has a sale?), BUT your REAL income (or the purchasing power of your income will increase.
|
|
So, when pizza prices decrease your real income increases. (This is like the price of pizza staying the same but you get a raise.) The result is that we buy more pizza (the quantity of pizza demanded increases when the price decreases.) This explains why the law of demand is true.
Substitution Effect
The third explanation of the law of demand is the "substitution effect". Remember that we are trying to explain why the quantity demanded increases if the price decreases or why the demand curve is downward sloping from left to right.
|
|
If the price of pizza decreases what happens to the price of Chinese food at the restaurant down the street? Probably nothing. (I know that the Chinese restaurant where My wife and I eat does not change their prices when Pizza Hut has a sale.) But the RELATIVE price of Chinese food does increase. compared to pizza, Chinese food looks more expensive.
|
|
Now, as my wife and I drive past Pizza Hut on our way to the
Chinese restaurant and we see that Pizza Hut has a sale
(![]() price of pizza) we start to think that the Chinese food
seems more expensive compared to the now cheaper pizza (
price of pizza) we start to think that the Chinese food
seems more expensive compared to the now cheaper pizza (
![]() relative price of Chinese food ). So we may decide to eat at Pizza
Hut and substitute pizza for the relatively more expensive Chinese
food (
relative price of Chinese food ). So we may decide to eat at Pizza
Hut and substitute pizza for the relatively more expensive Chinese
food ( ![]() quantity of pizza demanded). This helps explain why we buy
more pizza when the price decreases.
quantity of pizza demanded). This helps explain why we buy
more pizza when the price decreases.
Market Demand
Definition:
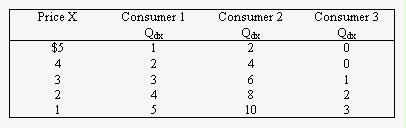
Market demand is the horizontal summation of the individual demand curves. Or, instead of just my individual demand for a product what if there were two people, or more, in the market. the result would be tat for each price, the quantities demanded would be greater since there are more people. The prices stay the same, but the quantities get larger, or the demand graph shifts horizontally (to the right).
Graphically:
Given the following individuals' demand schedules for product X, and assuming these are the only three consumers of X, which set of prices and output levels below will be on the market demand curve for this product?
A.
($5, 2); ($1, 10)
B.
($5, 3); ($1, 18)
C.
($4, 6); ($2, 12)
ANSWER
D.
($4, 0); ($1, 3)
Determinants of Demand
The price of the product
Economists stress the importance of price in determining how much people will buy. That is why they put price on the demand graph, but there are other things that affect how much of a product we buy besides the price. When we developed my demand curve for pizza we employed the ceteris paribus assumption. I didn't get a large increase in my income. I didn't win the lottery. There wasn't a new study out that stated pizzas cause cancer. All other factors remained the same - only the price and quantity demanded changed.But there are other determinants of how much we demand (or buy) besides the price. We call these the Non-Price determinants of Demand.
The non-price determinants of demand
Let's not talk about pizzas anymore and use a new product in our examples. - - - How about vodka? We know that when the price of vodka goes up we buy less and when the price goes down we buy more (this is the law of demand). But what else might cause us to buy more vodka besides the price? In other words, IF THE PRICE OF VODKA STAYED THE SAME, what might cause us to buy more or less vodka?Economists classify the non-price determinants of demand into 5 groups:
- expected price (Pe)
- price of other goods (Pog)
- income (I or Y) (In Macroeconomics "I" usually stands for "investment" and "Y" stands for "income".)
- number of POTENTIAL consumers (Npot), and
- tastes and preferences (T).
Let's briefly look at each one here and in more detail later.
Pe - If we hear that there will be a new $5 tax on a bottle of vodka beginning next week, what happens to the amount of vodka sold this week at the current price? It probably increases since some people will buy more now to avoid the higher future prices.
Pog - What happens to the amount of vodka sold if the price of gin increases? Might not some people who were going to buy gin buy vodka instead since the price of gin went up? Or what might happen to vodka sales if the price of tomato juice goes down? maybe now with the cheaper tomato juice prices some people might want to drink more bloody marys (vodka mixed with tomato juice)? If so, vodka sales would go up.
Y (or I) - If I get a raise and my income increases I might buy more vodka - or if my income goes down I would probably buy less vodka. (And if I lost my job I might buy a lot of vodka :-)
Npot - What would happen to vodka sales if they lowered the drinking age. This would increase the number of potential vodka consumers and they would probably sell more vodka.
Finally T - Tastes and preferences really means "everything else". There are hundreds of factors that affect the quantity of vodka sold. We don't want to memorize hundreds of different determinants for each product, so economists group everything else into "tastes and preferences". Anything that might make consumers want more or less vodka will change the quantity sold. For example, if a new study says that drinking vodka causes blindness - people will buy less. Right before a holiday people may buy more.
In order to remember these determinants of demand, think of somebody who has had too much vodka to drink and they come staggering into a liquor store demanding, "G-g-give m-me an-n-n-nother p-p-p-pint of v-v-vodka".
Get it? "p-p-p-pint " or P, P, P, I, N, T or Px, Pe, Pog, I, Npot, T
In order to save me time in typing, I will type "P, P, I, N, T" instead of "the non-price determinants of demand".
Two Kinds of Changes Involving Demand
If the price of a product increases what happens to demand for
that product? For example, If the price of pizza increases, then the
demand for pizza does what? NOTHING, demand does not change
when the price changes, but the quantity demanded does change. This
section will help us to better understand the difference between a
change in quantity demanded (![]() Qd)
and a change in demand itself (
Qd)
and a change in demand itself (![]() D).
[The triangle, "
D).
[The triangle, "![]() ",
means "change".]
",
means "change".]
Change in Quantity Demanded (![]() Qd)
Qd)
A change in quantity demanded caused ONLY by a change in the PRICE of the product. On a graph it is represented by a movement ALONG a SINGLE demand curve.
So if the price of pizza increase from $6 to $9 we will get an
decrease in quantity demanded (![]() Qd)
from 5 pizzas to 3 pizzas. This does not change the demand schedule
(the numbers in the table do not change) or the demand curve (the
demand curve does not move). Demand does not change. But it does
result in a movement along the SAME demand curve.
Qd)
from 5 pizzas to 3 pizzas. This does not change the demand schedule
(the numbers in the table do not change) or the demand curve (the
demand curve does not move). Demand does not change. But it does
result in a movement along the SAME demand curve.
Change in Demand (![]() D)
D)
When there is a change in demand itself we get a new demand schedule (new numbers) and curve (it moves). We have to change the numbers in the demand schedule and this will SHIFT the demand curve.
If there is an increase in demand ( ![]() D) the numbers on the table get bigger and when we plot
these larger numbers the demand curve moves to the RIGHT.
D) the numbers on the table get bigger and when we plot
these larger numbers the demand curve moves to the RIGHT.
When we say that the demand curves shift to the right, it means that we have to change the numbers on the demand schedule. For the same prices, the quantities increase. This shifts the curve to the RIGHT.
A decrease in demand will then shift the demand curve to the LEFT. For each price on the demand schedule, the quantities decrease.
Be sure to draw your arrows to the RIGHT and LEFT. Many students want to draw the arrows perpendicular to the demand curve. Don't do this. Always draw your arrows horizontally because this indicates the the prices are the same, and only the quantities change. It does NOT shift up nor up and to the right. It moves horizontally to the right. Look at the black arrows in these graphs. They are horizontal. This is important, please always draw you arrows horizontally. This is especially true when we discuss a change in supply later.
A change in demand is caused by a CHANGE in the non-price determinants of demand:
If these change we get a new demand schedule and curve. To understand why prices are what they are, and why they change, we need to understand very well how these determinants move the demand curve. This is where it all begins. In our definition of demand we held these things constant (ceteris paribus), but in the real world these things do change, changing demand, and ultimately changing prices. So let's look at each determinant individually to understand how they each affect demand. these determinants are very important. Be sure you know how they work (i.e. learn the DIRECTION of the ARROWS).
![]() Pe
-- expected price
Pe
-- expected price
Pe in the future

Pe in the future
If you expect the price to go up in the future demand today will increase (shift to the right). For example, if we read that there will be a new tax on vodka starting next week, people will want to buy more now before the price increases. Retailers understand this. How often have you heard "SALE ENDS MONDAY"? They want you to expect the price to increase in the future so you'll buy it today.
The opposite happens when you expect the price to go down in the future. In the past when my wife and I were shopping whenever I put something in the cart, she would take it out and put it back on the shelf! I'd ask, "why are you doing that?". She would say that she expected it to go on sale soon and we should wait until it does. If you expect the price to go down in the future demand today decreases. (f ¯Pe in the future Þ ¯D today). But, whenever I put something in the cart, she would take it out saying that she expects it to go on sale soon. After awhile I got a little upset, when I'd ask her about the items she put in the cart and she'd say that they were on sale last week and we missed it. Finally, I went to talk to the store manager and explained the situation to him. He saved our marriage by explaining that most chain store have a policy stating that if an item goes on sale after you have purchased it, you can bring in the receipt within 30 days and get a refund. Retailers understand how price expectations affect demand.
![]() Pog
-- price of other goods
Pog
-- price of other goods
The effect of a change in the price of other goods on demand depends on what type of other goods we are talking about. There are three types:1) substitute goods
Substitute goods are goods where if you buy more of one, you buy less of the other one. Examples of substitutes include vodka and gin, hot dogs and hamburgers, chicken and beef, Coca-Cola and Pepsi.Let's look at Coke and Pepsi. If the price of Coke increases it will increase the demand for Pepsi (the graph shifts to the right).I f you are going to buy a can of Coke, you may walk right past the Pepsi machine, but when you notice that the price of Coke has increased, you'll probably turn around and buy the Pepsi. You weren't going to buy Pepsi before, but now, at the same price, you are willing to buy it. So the demand for Pepsi has increased. The demand curve has shifted to the right. At the same prices, the quantities demanded are greater.
If the price of Coke increases, what happens to the demand for Coke? - - - NOTHING. Price does not change demand (as we have defined it) but it will change the quantity demanded.
You've seen a good example of this in your local grocery store. For example, I may want to buy some coffee. So I go to the coffee aisle and grab a can of Folgers and continue down the aisle. But at the end of the aisle I see a display of Maxwell House coffee on sale! What do I do with the Folgers in my shopping cart? - - - - - No, I don't put it back. I take it out of my cart and put it on the Maxwell House display. Haven't you seen various brands mixed in with such displays? The demand for Folgers decreased (I no longer want it at that price, so I take it out of my cart) because the price of Maxwell House decreased.
If:
2) complementary goods
Complementary goods are goods where if you buy more of one you also buy more of the other one. they go together like vodka and tomato juice, rum and Coke, film and film developing, hot dogs and hot dog buns.Let's say that you want to eat hot dogs tonight and you go to your local grocery store and put a bag of buns in your cart and head down the aisle to the wieners. When you get to the wiener display you notice that their price has increased significantly so you decide not to eat hot dogs. What are you going to do with the buns? You should put them back, but if you are like many people you'll put them in the wiener display and move on quickly. But the point is, you were going to buy the buns at their present price (they were already in your cart), but when you learned the price of hot dogs increased your demand for buns decreased (the demand curve shifted to the left - at the same prices the quantities demanded decreased).
Of course, if the price of one product decreases (cheaper film developing), the demand for its complement (film) increases.
3) independent goods
Independent goods are goods where if the price of one changes, it has no effect on the demand for to other one. For example, what happens to the demand for paper clips if the price of surfboards increases? Nothing.
Summary (Pog):
![]() I
-- income
I
-- income
1) normal goodsFor most goods, called normal goods, if consumer incomes increase, demand will increase and vice versa.
So if incomes increase, the demand curve for restaurant meals, and cars, and boats, will shift to the right. At the same prices people will buy more.
2) inferior goods
For some goods, called inferior goods, if consumer incomes increase demand will decrease, and vice versa. If only you had more money, you would buy less of that product
The term "inferior good" does not mean they are of low quality. the definition of an inferior good is one where if your income increases, demand decreases. There is an inverse relationship between income and demand.
Examples of inferior goods might include used clothing, potatoes, rice, maybe generic foods. If you lose your job (so your income decreases) you may shop for clothes at the Salvation Army Thrift Store (demand for used clothing increases).
What is a normal good for one consumer might be an inferior good for another. For example, if the income of one family increases they may buy a second small car (a normal good), but for another family, an increase in income may mean that they don't buy a small car (an inferior good) anymore and they buy a mini van instead.
![]() Npot
-- number of POTENTIAL consumers
Npot
-- number of POTENTIAL consumers
An increase in the number of potential consumers will increase demand and vice versa.
Earlier we say that if they lowered the drinking age, the demand for vodka would increase.
Often economists say that an increase in the "number of consumers" will increase demand. I prefer to use the terminology "number of POTENTIAL consumers" because if K-Mart has a sale on Pepsi (price of Pepsi decreases) what happens to demand for Pepsi? -- Nothing (price does not change the demand schedule). But, if K-Mart has a sale on Pepsi (price of Pepsi decreases) what happens to the number of consumers buying Pepsi? It will increase. (The law of demand says that if price goes down, quantity demanded goes up.) So, if they have more customers because the price went down, what happens to demand? Nothing - (price does not change the demand schedule).
But, if the number of POTENTIAL customers changes, demand will change.
Four circumstances can change the number of potential consumers:
- population change
If a new housing development is built in the empty field behind a small store, the number of potential consumers increases, and demand will increase.
- expanded marketing area
Coors beer used to sold only out West. President Ford used to have to have it flown in to the While House because you couldn't buy it anyplace else. Then when Coors expanded to all states, demand increased because now there are more potential consumers.
- new competitor (changes the demand curve facing and individual store, but NOT market demand curve)
If a new liquor store moves in across the street from and existing store, the demand for liquor of the existing store will decrease since now there are fewer potential consumers since some of the consumers walking past the store will have already bought something at the new store.
- change in eligible consumers (i.e. drinking age)
If they lower the drinking age there will be more potential vodka drinkers so demand for vodka will increase.
![]() T
-- tastes and preferences
T
-- tastes and preferences
There are hundreds of factors that affect the quantity of vodka sold. We don't want to memorize hundreds of different determinants for each product, so economists group everything else into "tastes and preferences". Tastes and preferences really refers to "everything else". Anything that increases a consumer's preference for a product will increase demand for that product. This will include advertising and fads.
Supply
Introduction
Supply is more difficult for students to understand than demand. We are all consumers (demanders), but few of us own a business (suppliers). So, remember to think of yourself as a business owner when we discuss supply.
Definition
Supply is a schedule which shows the various quantities businesses are willing and able to offer for sale at various prices in a given time period, ceteris paribus.
Supply is NOT the quantity available for sale. This is the way the term is often used in the popular press. Supply is the whole schedule with many prices and many quantities.
Just like with demand, there is a difference between a change in quantity supplied and a change in supply itself. So, if the price increases what happens to supply? The best WRONG answer would be "supply increases", but it doesn't. Price does not change supply, it changes quantity supplied, because supply means the whole schedule with various prices and various quantities.
Supply Schedule and Curve
Below is a hypothetical supply schedule for pizza.

If we plot these points (remember any point on a graph simply represents two numbers) We get the graph below.
If we assume there are quantities and prices in-between those on the schedule we get a supply curve.
Law of Supply
The law of supply states that there is a direct relationship between price and quantity supplied. In other words, when the price increases the quantity supplied also increases. This is represented by an upward sloping line from left to right.
Why?
Why is the law of supply true? Why is the supply curve upward sloping? Why will businesses supply more pizzas only id the price is higher? I think it is just common sense. If you want the pizza places to work harder and longer and produce more pizzas, you have to pay them more, per pizza. But economists, as social science, want to explain common sense. We know businesses behave this way, but why?
There are two explanations for the law of supply and both have to do with increasing costs. Businesses require a higher price per pizza to produce more pizzas because they have higher costs per pizza. Why?
First, there are increasing costs because of the law of increasing costs. In a previous lecture we explained that the production possibilities curve is concave to the origin because of the law of increasing costs. the law of increasing costs is true because not all resources are identical. Let's say a pizza place is just opening. The owner figures that they will need five employees. After putting an ad in the paper there are twenty applicants. Five have had experience working in a pizza place before. They came to the interview clean and on time. The other fifteen had no work experience. Many came late. A few were caught steeling pepperoni on the way out. One spilled flour all over the floor. Which applicants will be hired? Of course it will be the five with experience and the other fifteen will be rejected because they would be too costly to hire. NOW, if the pizza place wants to produce more pizzas they will need more workers. This means they will have to hire some of those who were rejected because they were more costly (less experienced, etc.). So, they will only hire the more costly employees if they can get a higher price to cover the higher costs. this is one explanation why the supply curve is upward sloping.
Second, there are increasing costs because some resources are fixed. This should not make sense to you. Why would there be increasing costs if we use the same quantity of some resource? Well, let's say that the size of the kitchen and the number of ovens (capital resources) are fixed. This means that they don't change. Now, if we want to produce more pizzas you will have to cram more workers into the same size kitchen. As they bump into each other and wait for an oven to be free they still get paid, but the cost per pizza increases. Therefore they will not produce more pizza unless they can get a higher price to cover these higher per unit costs. So the supply curve should be upward sloping.
Market Supply
Market supply is the horizontal summation of the individual supply curves. Instead of looking at how many pizzas one pizza place is willing and able to produce at different prices (individual supply), we keep the prices the same and add the quantities of additional pizza places. Prices stay the same, but quantities increase because there are more pizza suppliers. So the market supply of pizzas is further to the right (horizontal) than the individual pizza place supply curves.
determinants of Supply
The price of the product
(![]() P)
P)
Economists stress the importance of price in determining how much will be produced. That is why they put price on the supply graph, but there are other things that affect how much of a product will be produced besides the price. When we developed the supply curve for pizza we employed the ceteris paribus assumption. we assumed all other things stayed constant. For example there were no new technological discoveries, the prices of resources stayed the same, or no change in taxes. All other factors remained the same - only the price and quantity supplied changed.But there are other determinants of how much business supply besides the price. We call these the Non-Price determinants of Supply.
The non-price determinants of Supply
Economists classify the non-price determinants of supply into 6 groups:a. Pe -- expected price
b. Pog -- price of other goods ALSO PRODUCED BY THE FIRM
c. Pres -- price of resources
d. T --technology
e. T --taxes and subsidies
f. N -- number of producers/sellers
|
|
Two Kinds of Changes Involving Supply
Change in Quantity Supplied (![]() Qs)
Qs)
A change in Quantity supplied caused ONLY by a change in the PRICE of the product. It is represented by a movement ALONG a SINGLE supply curve.
Change in Supply (![]() S)
S)
A change in supply is a shifting the supply curve because there is a new supply schedule. The supply curve either moves left or right (horizontally) since the prices stay the same and only the quantities change and quantity is on the horizontal axis. Be sure to draw your arrows to the RIGHT and LEFT. Many students want to draw the arrows perpendicular to the supply curve. Don't do this. Always draw your arrows horizontally because this indicates the the prices are the same, and only the quantities change. Also, if you draw you arrows perpendicular to the supply curve and arrow pointing UP will indicate a DECREASE in supply. That could get confusing!
A change in supply is caused by a change in the non-price determinants of supply. These are the factors that we assumed were constant when we used the ceteris paribus assumption to develop the supply curve.
Increase in Supply
If there is an increase in supply (
Decrease in Supply
If there is an decrease in supply (
A increase in supply does NOT shift the graph up nor up and to the left. It moves horizontally to the RIGHT. Be sure to draw your arrow HORIZONTALLY. If you draw the arrow perpendicular to the supply curves than you will shift the graph the WRONG WAY! Look at the black arrows in these graphs. They are horizontal. This is important, please always draw you arrows horizontally. This is especially true when we discuss a change in supply later. A decrease in supply does NOT shift the graph down nor down and to the right. It moves horizontally to the LEFT.
Changes in supply are caused by a CHANGE in the non-price determinants of supply
Pe -- change in expected price
Let's look at these determinants on at a time. We must know how they shift the supply curve if we are to use the supply and demand tool to understand how prices are determined in a market economy.
![]() Pe
-- expected price
Pe
-- expected price
If a business expects that they can get a higher price in the future, what will happen to supply today? They will be less willing to sell there products today because they will know that if they waited they could get a higher price so supply today would decrease, shift to the left. (Remember, supply is not the quantity available for sale.)Let's say that you want to sell you car, somebody offers you $1500 today, and you accept it. You are willing to sell your car for $1500 today. THEN, somebody says that they will dive you $2000 for your car if you could wait three days. Now you expect that you can get a higher price ($2000) in the future, so you will probably no longer want to sell your car for $1500 today.
![]() Pog
-- price of other goods ALSO PRODUCED BY THE FIRM
Pog
-- price of other goods ALSO PRODUCED BY THE FIRM
First, think of a business that produces two products, like farmers who can either grow corn or soybeans. Then the price of one increases, what happens to the supply of the other one.So if the price of soybeans increases, what happens to the supply of corn?
If the price of soybeans increases the supply of corn will decrease. The supply curve of corn will shift to the left as farmers plant more soybeans and less corn.
If the price of soybeans increases, what happens to the supply of soybeans?
-
-
-
Nothing. Remember, price does not change supply, it changes the quantity supplied. so if the price of soybeans increases, we would get an increase in the quantity supplied (same supply curve, higher quantity).
The price of resources ( ![]() Pres
), improved technology (
Pres
), improved technology (![]() Tech),
and taxes and subsidies (
Tech),
and taxes and subsidies (![]() Tax)
all affect supply because they change the costs of production
Tax)
all affect supply because they change the costs of production
![]() Pres
-- price of resources
Pres
-- price of resources
If the price of a resource used to produce the product increases, this will increase the costs of production and the producer will no longer be willing to offer the same quantity at the same price. They will want a higher price to cover the higher costs. This shifts the supply curve to the left (For Example: if the autoworkers unions receives a significant wage increase, this will increase the costs of producing cars and decrease the supply of cars (
![]() Tech
--technology
Tech
--technology
Does improved technology increase or decrease the costs of producing a product?Improved technology DECREASES costs and therefore increases supply. If the technology did not decrease costs, then it wouldn't be used. If there is a high-tech expensive way to produce a product and a low-cost, low-tech, way to produce the same product, companies that use the low-cost methods will be able to sell the product at a lower price and beat out the high-cost producers.
Improved technology
What has improved technology done to the costs of medical care? Improved medical technology has INCREASED the cost of medical care BUT it has also changed the outcome. For example let's say that there is a disease where with existing low-cost technology, half the patients die. Now, if they invent a new high-cost technology that will save all lives which technology will be used? Of course the new high-cost technology will be used, BUT THE PRODUCT HAS CHANGED. One product is when half the patients die, the other product is when all patients live. We can't put two products on one supply curve.
Let's use one more medical example. Why do doctors still use low-tech stethoscopes? they were using similar stethoscopes a hundred years ago. Isn't here a high-tech electronic stethoscope? Yes there is, so why don't doctors use it? Because it is more expensive AND IT GIVES THE SAME RESULTS. Doctors will use the cheaper technology as long as the results are the same. but obstetricians do use the more expensive high-tech stethoscope because it gives them better results. The low-tech stethoscopes can't always pick out the fetal heart beat. the newer high-tech and higher-cost electronic stethoscopes can. The product changes.
So, improved technology will decrease costs and increase supply OR it will increase costs and change the product which we cannot put on one graph.
![]() Tax
--taxes and subsidies
Tax
--taxes and subsidies
Here we will discuss excise taxes. Excise taxes are a "per-unit" tax imposed on the production or sale of a product. Examples include the gasoline tax (so much per gallon), the cigarette tax (so much per pack) and the liquor tax (so much per bottle).Let's discuss the gasoline tax. If the tax on gasoline increases will this affect the demand for gasoline or the supply of gasoline? If you said demand - then which non-price determinant of demand has changed? remember price does not change demand.
If the tax on gasoline increases, this will raise the cost of SELLING gasoline, and DECREASE SUPPLY.
Who pays the gasoline tax? Who pays the wages of the gas station employees? Whether you answer the consumer of the gas station owner, you have to give the same answer for both questions. Both taxes and wages are costs to the producer or seller. Higher gasoline taxes do not shift the demand curve, but they may result in a higher price and therefore a decrease in quantity demanded.
Subsidies are the opposite of taxes. Instead of the business paying the government, the government pays the business. There are fewer subsidies than taxes. But let's say the the government wants to encourage the use of solar energy so they put a subsidy (or increase one) on solar energy equipment. this will decrease the costs of producing or selling the equipment because when they produce or sell one they get a refund (subsidy) from the government.
![]() N
-- number of producers/sellers
N
-- number of producers/sellers
An increase in the number of producers of a product will increase supply of that product. If the number of computer manufacturers increases, the supply of computers will increase (shift to the right).
Market Equilibrium -- Equilibrium Price and Quantity
Now we are ready to discuss PRICES. At the top of this online lecture I said:
"In a capitalist society prices are determined by the interaction of demand and supply. Since prices are so important, we need to better understand how they are determined. why is the price of gasoline $1.59 a gallon. Why does a candy bar cost $0.75? Why is the price of plywood normally $10 a sheet, but $30 a sheet after a hurricane?"
Market Equilibrium
Equilibrium means that there is no further tendency to change. When something is at equilibrium, it is at rest, not changing. Like a pendulum. When it is swinging, it is changing. We call this disequilibrium. Eventually, it will stop swinging and achieve equilibrium.
Prices do something similar. They move toward an equilibrium where they come to rest and don't change. But just like you can push a pendulum and cause it to swing and then slow down and achieve equilibrium again, prices can be "pushed" and they will change to a new equilibrium. It is the non-price determinants of demand and supply that "push" prices to a new equilibrium. We call this "market equilibrium".
The equilibrium price is the price where the quantity demanded equals the quantity supplied. ("Market clearing" or "market price" is another name for equilibrium price.)
Sometimes I hear people say that equilibrium is where demand equals supply. It is impossible for the whole demand curve to be the same as the whole supply curve because the demand curve slopes downward and the supply curve slopes upward.(NOT: D = S), but there is one price where the quantity demanded equals the quantity supplied.
Market Disequilibrium
Why will the price of pizzas be $9? Well, let's take a look at what happens if the price is not at equilibrium.
If the price is $12, the quantity demanded is 2000 (Qd = 2000) and the quantity that businesses are willing to supply is 4000 (Qs = 4000). The result will be a surplus of 2000 pizzas (4000 - 2000 = 2000). If there is a surplus (more available than consumers are willing to purchase) the price will change - decrease. Twelve dollars is not equilibrium - it will change.
See graph.
If the price is $6, the quantity demanded is 5000 (Qd = 5000) and the quantity that businesses are willing to supply is 2000 (Qs = 2000). The result will be a shortage of 3000 pizzas (5000 - 2000 = 3000). If there is a shortage (consumers are willing to purchase more than is available) the price will change - increase. Six dollars is not equilibrium - it will change.
See graph.
Changes in Demand AND Supply
Now that we can find equilibrium AND we know what causes supply or demand to change, let's see what happens to the equilibrium price and quantity if supply and/or demand changes. After we do this, we will put it all together. It all begins with a change in one of the eleven non-price determinants:
DEMAND:
SUPPLY:
so you must know how they affect the graphs. We discussed this above and will review it again soon. Here, let's just concentrate on what happens to price and quantity if demand and/or supply changes.
Case 1: D changes and supply stays the same
If demand increases (shifts to the right) what effect will this have on PRICE and QUANTITY. Be sure to DRAW THE GRAPHS. You can probably guess what will happen to price and quantity and get it correct quite often, but why guess when you can draw the graphs and get it right almost all the time? BE SURE TO DRAW THE GRAPHS!
So, if demand increases and supply stays the same you get (see graph):
|
|
|
Demand increases:
|
If demand decreases (shifts to the left) and supply stays the same you get (see graph):
|
|
|
Demand decreases:
|
This is quite easy, but the key to understanding this are the non-price determinants of supply and demand. We will review them soon.
Case 2: S changes and demand stays the same
If supply increases (shifts to the right) what effect will this have on PRICE and QUANTITY. Be sure to DRAW THE GRAPHS. You can probably guess what will happen to price and quantity and get it correct quite often, but why guess when you can draw the graphs and get it right almost all the time? BE SURE TO DRAW THE GRAPHS!
So, if supply increases and demand stays the same you get (see graph):
|
|
|
Supply increases:
|
If supply decreases (shifts to the left) and demand stays the same you get (see graph):
|
|
|
Supply decreases:
|
Case 3: D and S both change
What if BOTH supply and demand change at the same time? This means what happens to price and quantity if a non-price determinant and supply AND a non-price determinant of demand change shifting the graphs at the same time?
1. S increases, D decreases
DON'T LOOK!!!
Graph it right now and determine what would happen to price and quantity if supply increases and demand decreases.
In a face-to-face class I would have my students do this themselves and tell me what happens to P and Q. So let's do it in this distance learning class.
-
-
-
-
What do you get? What happens to price and quantity if supply increases (shifts to the right) and demand decreases (shifts to the left)?
-
-
If supply increases and demand decreases:
- price decreases
- quantity is Indeterminate
The price will decrease, but we cannot tell what happens to quantity. Quantity could increase, it could decrease or it could stay the same. What happens to quantity depends on how much the supply and demand curves shift and since we were not told this, we cannot determine what happens to quantity. Quantity is indeterminate.
See the graph below where we can see that if demand decreases a little (D2) then the equilibrium quantity will increase, but if the demand curve decreases a lot (D4) the equilibrium quantity will decrease.
2. S decreases, D increases
What happens to price and quantity if supply decrease and demand increases?GRAPH IT!
-
-
-
-
If supply decreases and demand increases:
- price increases
- quantity is indeterminate
The price will increase, but we cannot tell what happens to quantity. Quantity could increase, it could decrease or it could stay the same. What happens to quantity depends on how much the supply and demand curves shift and since we were not told this, we cannot determine what happens to quantity. Quantity is indeterminate. Try graphing different shifts in D and S and see what happens to quantity.
3. S increases, D increases
What happens to price and quantity if both supply and demand increase (shift to the right)?GRAPH IT before scrolling (or looking) lower on this page.
-
-
-
-
If supply increases and demand increases:
- quantity increases
- price is Indeterminate
The quantity will increase, but we cannot tell what happens to price. The price could increase, it could decrease or it could stay the same. What happens to the price depends on how much the supply and demand curves shift and since we were not told this, we cannot determine what happens to price. Price is indeterminate.
See the graph below where we can see that if supply increases a little (S1) then the equilibrium price will increase, but if the supply curve increases a lot (S3) the equilibrium price will decrease.
4. S decreases, D decreases
What happens to price and quantity if supply decrease and demand increases?GRAPH IT!
-
-
-
-
If supply decreases and demand decreases:
- quantity decreases
- price is indeterminate
The quantity will decrease, but we cannot tell what happens to price. price could increase, it could decrease, or it could stay the same. What happens to price depends on how much the supply and demand curves shift and since we were not told this, we cannot determine what happens to price. Price is indeterminate. Try graphing different shifts in D and S and see what happens to price.
Now let's put it all together. We can use our supply and demand
model to understand why prices change. It all begins with the
non-price determinants of demand (![]() Pe,
Pe,
![]() Pog,
Pog,
![]() I,
I,
![]() Npot,
Npot,
![]() T)
and the non-price determinants of supply (
T)
and the non-price determinants of supply ( ![]() Pe,
Pe,
![]() Pog,
Pog,
![]() Pres,
Pres,
![]() Tech,
Tech,
![]() Tax,
Tax,
![]() Nprod
). These are the factors in the real world that cause prices
to change.
Nprod
). These are the factors in the real world that cause prices
to change.
We will use supply and demand curves to illustrate how changes in these non-price determinants will affect the price and quantity of a product, ceteris paribus. Before you guess, answer the following questions:
(1) Which determinant has changed?
(2) Will it affect supply or demand?
(3) Will supply or demand increase or decrease?
(4) GRAPH IT! What happens to price and quantity?
|
|
Our goal is to understand what happens to PRICE and QUANTITY, but don't just guess. If you do just think about it and try to figure it out in your head, you'll probably get it right a lot of the time. But wouldn't you rather get it right most, or all, of the time? We now have a tool (supply and demand) that we can use to better understand changes in price and quantity. So use the tool. Once you get used to it you'll see its benefits.
Answer the four questions and the graph (tool) will give you the answer.
(1) Which determinant has changed?Sometimes this is obvious. In this example it is income.(2) Will it affect supply or demand?
Income is a determinant of DEMAND. But at other times this is more difficult. For example Pe and Pog are determinants of BOTH demand and supply.(3) Will supply or demand increase or decrease?
This is the key to using the tool correctly. We discussed above how the non-price determinants shift the curves. Computers are normal goods. This means that if incomes increase, demand for computers will increase.(4) Finally, GRAPH IT! the graph will tell you what happens to price and quantity. See graph below.
|
|
|
Answer: So if consumer incomes increase, ceteris paribus, the price of computers will increase and consumers will buy more.
|
|
(1) Which determinant has changed?TECHNOLOGY(2) Will it affect supply or demand?
SUPPLY(3) Will supply or demand increase or decrease?
SUPPLY WILL INCREASE (shift to the right)(4) GRAPH IT! What happens to price and quantity?
|
|
|
|
|
If the graph above is for Nintendo 64 Video Game Systems, what will happen to the price and quantity if there is a decrease in the price of personal computers?
(1) Which determinant has changed?Pog - the product on the graph is Nintendo Video Game Systems and the price of another product, computers, has changed(2) Will it affect supply or demand?
The non-price determinant, Pog, is a determinant for both supply and demand. With supply we said it refers to the price of other good PRODUCED BY THE SAME FIRM. Does Nintendo also produce computers? NO.With demand, Pog refers to the price of substitute and the price of complements. Are video game systems and home computers substitutes or compliments? Most people would say they are substitutes. If you buy a new home computer, you can play games on the computer and maybe you won't buy a new video game system.
So, if there is a decrease in the price of personal computers, DEMAND FOR VIDEO GAME SYSTEMS WILL CHANGE.
(3) Will supply or demand increase or decrease?
if there is a decrease in the price of personal computers, DEMAND FOR VIDEO GAME SYSTEMS WILL DECREASE (shift to the left).(4) GRAPH IT! What happens to price and quantity?
|
|
|
In the "real world" the determinants are not as easy to pick out. The tool still works, but it takes a little more practice.
If you read a newspaper or Internet news article about a product whose price and/or quantity has changed, you can use supply and demand to analyze WHY the price and/or quantity has changed. We know that changes in the non-price determinants of demand and supply cause prices and quantities to change. So, to understand why, we have to look for the non-price determinants in the article.
REAL-WORLD EXAMPLE 1
Below is a portion of an article from CNNFN.COM http://cgi.cnnfn.com/output/pfv/2000/02/01/companies/pcs_prices/
Read the article looking for the cause of the price change and then use our supply and demand graph to ILLUSTRATE what has happened. This will be similar to the extra credit question that you will have on exam 1.
Remember to use our tool correctly:
(1) Which determinants have changed?
(2) Will they affect supply, demand, or both?
(3) Will supply or demand increase or decrease?
(4) GRAPH IT! Then show what happens to price and quantity?
Top PC makers cut prices
Compaq clears out old models; Dell passes on lower component costs
February 1, 2000: 2:44 p.m. ET
NEW YORK (CNNfn) - Two of the world's largest computer makers on Tuesday announced that they have cut prices on their commercial desktop PCs.
Compaq, the No. 1 PC maker, said it cut prices up to 13 percent on most of its Deskpro series commercial PCs. The price cuts are being made to clear the way for nine new Deskpro models. . . . . . . . . . . . . . . .Dell (DELL: Research, Estimates), the world's second largest supplier of PCs, said it was cutting prices because the cost of the components it uses to make them have also dropped.
Effective Monday, a Dell Precision WorkStation 210 with a Pentium III processor running at 650 million cycles per second will sell for $1,740, a 17.1 percent reduction, the company said. Dell also said it cut prices on the mid-range models in its Precision WorkStation 410 line by up to 15.5 percent.
(1) Which determinants have changed?
The article says "Dell (DELL: Research, Estimates), the world's second largest supplier of PCs, said it was cutting prices because the cost of the components it uses to make them have also dropped." This indicates the there has been a change in the price of resources ((2) Will they affect supply, demand, or both?
SUPPLY(3) Will supply or demand increase or decrease?
SUPPLY WILL INCREASE (shift to the right)(4) GRAPH IT! Then show what happens to price and quantity?
|
|
|
Below is a portion of an article from CNNFN.COM
http://cgi.cnnfn.com/output/pfv/2000/02/01/companies/pcs_prices/
Read the article looking for the cause of the price change and then use our supply and demand graph to ILLUSTRATE what has happened. This will be similar to the extra credit question that you will have on exam 1.
Remember to use our tool correctly:
(1) Which determinants have changed?
(2) Will they affect supply, demand, or both?
(3) Will supply or demand increase or decrease?
(4) GRAPH IT! Then show what happens to price and quantity?
Air customers to pay for fuel
With demand for seats still strong, most carriers announce fuel surcharges
By Staff Writer Chris Isidore
January 21, 2000: 3:54 p.m. ET
NEW YORK (CNNfn) - Airlines are finding a source of relief for oil price shocks they've rarely tapped before: their passengers.
With oil prices hitting a post-Gulf War high Friday, three more carriers - US Airways, America West and Trans World Airlines - announced surcharges, charging customers $20 per round-trip ticket on virtually all domestic flights.
That meant that eight of the nine largest carriers in the country now had the charges, with only No. 7 Southwest Airlines (LUV), the Dallas-based discount carrier, holding off at this time.
Demand for seats opens door
The surcharge is unique in its acceptance by the typically cutthroat airline industry, and is a sign that demand for air travel remains strong.
The Air Transport Association report that 71.3 percent of its members' seats were filled last year, the best rate in the history of passenger jet travel.
With demand remaining strong despite the spike, airlines are in a better position to seek higher fares.
"In the past, when we had the tremendous run up in fuel, we also had a recession," said David Swierenga, the ATA's chief economist. "Those two things together clobbered the industry. Now the economy is moving ahead, and carriers will have a little more flexibility on the pricing side.". . . . . . . . .
ANSWER: I have highlighted in red the important parts of this article. Let's analyze each one.
"With oil prices hitting a post-Gulf War high Friday, three more carriers - US Airways, America West and Trans World Airlines - announced surcharges, charging customers $20 per round-trip ticket on virtually all domestic flights."
(1) Which determinant has changed?PRICE OF RESOURCES. Oil (fuel) is a resources used by the airline industry(2) Will they affect supply or demand?
SUPPLY(3) Will supply or demand increase or decrease?
SUPPLY WILL DECREASE (shift to the left)(4) GRAPH IT! Then show what happens to price and quantity?
|
|
|
The article also says:
" The surcharge is unique in its acceptance by the typically cutthroat airline industry, and is a sign that demand for air travel remains strong." AND "Now the economy is moving ahead".
(1) Which determinant has changed?INCOME ("The economy is moving ahead" means incomes are rising.)(2) Will they affect supply or demand?
DEMAND(3) Will supply or demand increase or decrease?
DEMAND WILL INCREASE (assuming air travel is a normal good)(4) GRAPH IT! Then show what happens to price and quantity?
|
|
|
NOW LET'S PUT BOTH CHANGES ON THE SAME GRAPH. You must do this to show the overall effect of all changes. We have a decrease in supply caused by higher resource prices and an increase in demand caused by higher incomes,
The result is higher prices (see graph) and the quantity stays about the same as the article states (therefore I shifted the curves the same amount).
Other articles that you can analyze yourself:
All over the world countries are undertaking structural adjustment programs which remove price controls set by governments and allow the market (supply and demand) to set prices. WHY? Why are countries letting the market set prices rather than the government? Please not that this is still not universal, but it definitely is the trend. The reason is to better reduce scarcity.
A purely competitive market economy is an efficient economy, both allocatively and productively, but there is no mechanism to make them achieve equity or full employment. (5Es).
EQUITY - There is nothing built into capitalism or a market economy to guarantee that equity is achieved. Remember, economists cannot tell us when we have achieved equity. The distribution of income that maximizes society's satisfaction cannot be calculated therefore it is an issue left to the government. Economists can explain that equity is good for society (like we did in the 5Es lecture), but they cannot tell us when we have achieved equity.
PRODUCTIVE EFFICIENCY - Competition, or capitalism, through freedom of entry and exit ensures that production occurs at the lowest possible average cost and that there is no waste in production. Competition ensures production occurs at a minimum cost or other businesses will be able to produce and sell the product for cheaper. Inefficient businesses will be beat by their productively efficient competitors. There a capitalist economy, as long as there is competition, will achieve productive efficiency.
ALLOCATIVE EFFICIENCY -
Allocative efficiency is producing the right amount of the various goods and services so that society's satisfaction is maximized. Will business produce the quantity that society wants? The goal of businesses is to maximize their profits. Businesses will produce the profit maximizing quantity. This is the equilibrium quantity where Qd=Qs . This is WHAT WE GET in a market economy. Businesses do NOT try to be efficient, they try to maximize their profits. If a business could make more money by being inefficient they would be inefficient. Business try to produce the profit maximizing quantity, whether it is allocatively efficient or not.
But society wants the allocatively efficient quantity.
We can use Benefit-Cost Analysis that we studied in chapter 1 to draw a graph which show the allocatively efficient quantity, or the quantity that would maximize society's satisfaction. Remember, allocative efficiency means we are using our limited resources to produce the quantity of goods and services that maximizes society's satisfaction. For example, using resources to produce more MP3 players that people want and fewer CD players that they don't want.
Benefit Cost Analysis is the selection of ALL possible alternatives where the marginal benefits are greater than the marginal cost
select all where: MB > MC
up to where: MB = MC
but never where: MB < MC
We have made the best decision when we stop at the alternative where MB=MC. (Review page 13 of the textbook, see REVIEW, and use the Discussion Board if you still do not understand this important concept.)
The allocatively efficient quantity of a good, where society is receiving the maximum satisfaction, is the quantity where the marginal social benefits (MSB) equal the marginal social costs (MSC).
Marginal Social Benefits (MSB) are the additional benefits that society (or the consumer who is a part of society) receives when one more unit of a good or service is consumed.MARGINAL SOCIAL COASTS are the additional costs to society (or to the producer who is a part of society) when one more unit of a good or service is produced.
We will find out that if there are no negative externalities (spillover costs) then: S = MSC, and if there are no positive externalities (spillover benefits) the D = MSB,(We will study "externalities" in chapter 4)
THEREFORE: if D=MSB and if S=MSC, when businesses produce the profit maximizing quantity (where Qd=Qs) they will also be producing the allocatively efficient quantity (where MSB=MSC). Capitalism achieves allocative efficiency! This is why countries are abandoning price controls allowing profit maximizing businesses to set their own prices. As long as there is competition, as businesses try to maximize their profits they will also achieve allocative efficiency and there will be no shortages and no surpluses.
DOES D=MSB?
Your demand curve for any good is based on the marginal benefits (utility) that you would receive from consuming various possible amounts of the good, as we discussed when we explained the law of demand. Our assumptions imply that the marginal utility you receive from consuming is also the marginal benefit that society receives. That is, your gain is also society’s gain because you are a member of society. When we sum all consumer demands, we derive the market demand curve for an industry’s product, which is also the marginal social benefit (MSB) to all of society from having one more unit of the good. Therefore D = MSB.
DOES S=MSC
Does the supply curve for a product which shows the various quantity that the business is willing to produce measure the extra costs to society? There are two ways we can approach this. First, since the supply curve represents the cost of resources to the firm. It costs them more as they produce more so they need a higher price to comer these higher costs - this explains the law of supply. But when a firm uses more resources to produce more this is also a cost to society because society loses the use of that resource. Remember, all costs in economics are opportunity costs. So as more of a product is produced the marginal (extra) cost to society for one more unit increases.
The other way to look at this is to discuss what COULD HAVE BEEN PRODUCED. If a business produces more of a product, using more resources, then less of something else is produced, i.e. there is an opportunity cost. If we apply the law of diminishing marginal utility then as a business produces more of one product then society will have to receive less of other products. What happens to the marginal utility received from the last unit if LESS is consumed? If less is consumed then the marginal utility is higher. SO, as businesses produce more of product A then they produce less of product B. As they produce less of product B than the marginal utility received by society from product B increases. THEREFORE, as business produce more of product A the the cost to society of product A increases because as businesses product more of product A they must produce less of product B.
SUMMARY: When a purely competitive industry is in a long-run equilibrium, quantity supplied equals quantity demanded (this is the profit maximizing quantity) AND therefore marginal social cost equals marginal social benefit (MSC = MSB), this is the allocatively efficient quantity. The industry is producing where the marginal social benefit from the last unit produced is just equal to the marginal social cost of the resources needed to produce that unit of product. This concept is illustrated in the figure below.
The MSB = MSC condition is optimal from society’s point of view. This is the quantity where society's satisfaction will be maximized or the allocatively efficient quantity and scarcity is being reduced as much as possible.
Consider an output level slightly less than the efficient quantity shown above. The social benefit (MSB) from one more unit is greater than the cost of the resources required to produce a little more of the good (MSB>MSC). So society as a whole could gain if more resources were used to produce more of this good. And in a competitive industry, they will be. If this small quantity were initially produced and sold, existing firms in a competitive industry would enjoy economic profit. This would cause the industry to grow until the allocatively efficient quantity is reached. The adjustment process is just reversed if industry output exceeds the efficient level of output.
WHY ARE MARKETS EFFICIENT?
Businesses will produce the profit maximizing quantity. This is the equilibrium quantity where Qd=Qs (see graph below on the right). This is WHAT WE GET.
Society wants the allocatively efficient quantity. This is the quantity where MSB=MSC (see graph above on the left). This is WHAT WE WANT.
|
|
|
If there are no negative externalities (spillover costs) the S = MSC, and if there are no positive externalities (spillover benefits) the D = MSB, THEREFORE: WHAT WE GET = WHAT WE WANT and self-interested, profit maximizing, businesses will end up doing what is best for society - achieving allocative efficiency - as if there is some "invisible hand " guiding their decisions.
SUMMARY:
|
In a market economy with no positive externalities (spillover benefits) and no negative externalities (spillover costs):
|
Modified from Microeconomics by Ralph T. Burns and Gerald M. Stone, Harper Collins, New York 1993, pp. 210-212
Consider This … Ticket Scalping: A Bum Rap!
1. "Scalping" refers to the practice of reselling tickets at a higher-than-original price, which happens often with athletic and artistic events. Is this "ripping off" justified?2. Ticket re-sales are voluntary-both buyer and seller must feel that they gain or they would not agree to the transaction.
3. "Scalping" market simply redistributes assets (tickets) from those who value them less than money to those who value them more than the money they're willing to pay.
4. Sponsors may be injured, but if that is the case, they should have priced the tickets higher.
5. Spectators are not damaged, according to economic theory, because those who want to go the most are getting the tickets.
6. Conclusion: Both seller and buyer benefit and event sponsors are the only ones who may lose, but that is due to their own error in pricing and they would have lost from this error whether or not the scalping took place.
Efficient allocation - productive and allocative efficiency
1. Competitive markets generate productive efficiency - the production of any particular good in the least costly way. Sellers that don't achieve the least-cost combination of inputs will be unprofitable and have difficulty competing in the market.2. The competitive process also generates allocative efficiency - producing the combination of goods and services most valued by society.
3. Allocative efficiency requires that there be productive efficiency. Productive efficiency can occur without allocative efficiency. Goods can be produced in the least costly method without being the most wanted by society.
4. Allocative and productive efficiency occur at the equilibrium price and quantity in a competitive market. Resources are neither over- nor underallocated based on society's wants.
Market Supply: correct answer "B" [RETURN]

