|
The type of news articles that we should be able to understand after studying this chapter: |
OPTIONAL: http://www.federalreserveeducation.org/fed101/policy/basics.htm
The first thing we need to do is to develop another graph: the money market. Then we will add this new graph to two other graphs and we will have to use THREE GRAPHS TO SHOW HOW MONETARY POLICY WORKS:
Expansionary Monetary Policy: Increasing the MS to decrease UE:
Contractionary Monetary Policy: Decreasing the MS to decrease IN:
The extra credit question for exam three will include a short new article like the ones linked at the top of this lecture and you will have to (1) decide which monetary policy tool the Fed is using, (2) SHOW the effects of that monetary policy on these three graphs., and (3) discuss what happens to UE, IN, and EG.
So, what is that first graph?Money Demand
What is it?
- MD is our demand for liquidity
- it is our demand to keep some of our wealth in our wallets, purses, and checking accounts
- it is NOT a request for higher wages at work
The Demand for Money: Two Components
There are two sources of money demand or two reasons why do we want to hold M1 money in our wallets, purses, and in our checking account, instead of putting it in the back to earn interest. They are the (1) transactions demand and the (2) asset demand. The (3) Total demand for money (keeping money in our wallets and not in our savings account where they can earn interest) then is the transactions demand plus the asset demand.Transactions Demand for Money
Definition:
- We keep M1 money in order to buy things
- It is the demand for money as a medium of exchange
Transactions demand and nominal GDP
- directly related: when GDP increases the transactions demand for money also increases (shifts to the right).
- the main determinant of transactions demand is nominal GDP
Transactions demand and interest rates
- we'll assume that they are unrelated, so on a graph the transactions demand looks like:
Graphically
Asset demand
Definition:
- we keep some money so that we can spend it later
- the demand for money as a store of value
What determines how much money (M1) we keep in our wallets, purses, and checking accounts?
- The problem with holding money: is that you are not earning interest on it
- Asset demand and interest rates are inversely related
- if interest rates are high, people will keep less in their pockets and more in their savings accounts (and in other interest earning assets)
- if interest rates are low, people will keep more money in their pockets, because they are not losing much and it is more convenient
Therefore, graphically, the asset demand for money looks like:
 According to this graph, if interest rates on savings accounts are 10%, the quantity of money that we STORE in our wallets and checking accounts will be zero. Note: we would still keep some to buy things (transactions demand).
Total Money Demand
- Total MD = transactions demand + asset demand
- Graphically: The black vertical D1 is the transactions demand and the black, downward sloping D2 is the asset demand. If we add them together we get the blue total demand for money.
The Market for Money: Interaction of Money Supply and Demand
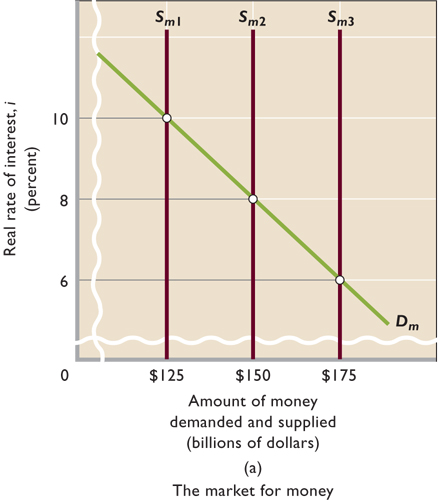
Now lets add the MS (money supply) graph from chapter 14. The graph below and textbook's Key Graph 16.1c illustrates the money market. It combines demand with supply of money.If the quantity demanded exceeds the quantity supplied, people sell assets like bonds to get money. This causes bond supply to rise, bond prices to fall, and a higher market rate of interest.
If the quantity supplied exceeds the quantity demanded, people reduce money holdings by buying other assets like bonds. Bond prices rise, and lower market rates of interest result (see example in text).
The Money Market
Graph:
The equilibrium interest rate then is where the MS an MD graphs cross. Now we can use the graphs to see how monetary policy works:
Expansionary monetary policy used to fight unemployment (UE):
This is a cause and effect chain of events. You must get the order right! The arrow go in only one directions.
FED BUY OMO
TOOLS ![]()
![]() ER
ER![]()
![]() MS
MS
![]() ¯Int.
Rates
¯Int.
Rates![]()
![]() I
I
![]()
![]() AD
AD
![]() DR
DR
![]() RR
RR
Lend more reserves through the term auction
facility
![]()
![]()
![]() real
GDP
real
GDP ![]()
![]() UE
and
UE
and ![]() EG
EG
![]() Price
Level
Price
Level
![]()
![]() IN
IN
Contractionary monetary policy used to fight inflation:
NOTE: Many students, for reasons that I still do not understand, often get this order of changes backwards. FIRST, see #1 in the graph above, the MS decreases, THEN, see #2 in the graph above, the interest rate increases. The decrease in the money supply CAUSES the interest rate to go up. Not the other way around.
- If we put it all together we get:
- Note the order:
- First the MS decreases (1) which CAUSES
- the interest rate to increase (2) which CAUSES
- the amount of investment to decrease (3) (the graph does not shift), this CAUSES
- AD to decrease (4) which CAUSES two things:
- the price level decreases (5) reducing inflation
- real GDP increases (5) causing UE to go up a little
This is a cause and effect chain of events. You must get the order right! The arrow in the figure below go only in one direction.
FED SELL OMO
TOOLS ![]()
![]() ER
ER![]()
![]() MS
MS
![]()
![]() Int.
Rates
Int.
Rates![]()
![]() I
I
![]()
![]() AD
AD
![]() DR
DR
![]() RR
RR
lend fewer reserves through the term auction
facility
![]()
![]()
![]() real
GDP
real
GDP ![]()
![]() UE
and
UE
and ![]() EG
EG
![]() Price
Level
Price
Level
![]()
![]() IN
IN
So, all that remains is: HOW does the Fed change the money supply? Or what are OMO, DR, RR, and the term auction facility?
Objectives of Monetary PolicyThe fundamental objective of monetary policy is to aid the economy in achieving full-employment output with stable prices (low inflation).To do this, the Fed changes the nation’s money supply. To change money supply, the Fed manipulates size of excess reserves held by banks (see chapter 15).The Fed has four tools to do this
- Open Market Operations (OMO)
- changing the discount rate (DR)
- changing the required reserve ratio (RR)
term auction facility (similar to the DR)Monetary policy has a very powerful impact on the economy, and the Chairman of the Fed’s Board of Governors, formerly Alan Greenspan, currently Ben Bernanke, is sometimes called the second most powerful person in the U.S. (I assume they believe the US president is the most powerful.)
From Chapter 14 we learned the functions of The Federal Reserve System (Fed):
1. issue currency = Federal Reserve Notes
2. setting reserve requirements
3. lending money to banks and thrifts (the discount rate -DR- is the interest rate banks are charged for borrowing from the Fed
4. providing for check collection
3. acting as fiscal agent for the US government
4. supervising banks
5. controlling the money supply
In chapter 15 we discussed how banks use their excess reserves to create money. In this chapter, we will see how the Fed uses the four tools available to it to change the amount of excess reserves and thereby change the money supply.
If there is HIGH UNEMPLOYMENT in the economy, the appropriate monetary policy policy and its effect illustrated on our graphs would be:
FIRST: Chapter 16 SECOND: Chapter 15 THIRD: Chapter 10 FINALLY: Chapter 12 and 13 To increase the MS the fed must increase the ER of
banks. Then banks could make more loans and create more
money. To do this they would use an easy money policy. Easy Money Policy: If the MS increases: If the interest rates decline: If investment increases:
![]() DR)
DR)![]() RR)
RR)
To understand how the Fed controls the money supply we first have to look at the Consolidated Balance Sheet of the Federal Reserve Banks. We studied the balance sheet of banks in chapter 15 and used them to show how banks create money. Here we will use the balance sheet of the Fed and the balance sheet of banks to show how the Fed and control the excess reserves of banks and thereby control the money supply. [I know I have already said this several times, and I will probably say it again. It must be important.]The assets column on the Fed's balance sheet contains two major items.
1. Securities, which are federal government bonds purchased by Fed, and2. Loans to commercial banks (Note: again commercial banks term is used even though the chapter analysis also applies to other thrift institutions.)
The liability side of the balance sheet contains three major items.
1. Reserves of banks held as deposits at Federal Reserve Banks,2. U.S. Treasury deposits of tax receipts and borrowed funds, and
3. Federal Reserve Notes outstanding, our paper currency.
Consolidated Balance Sheet of the Federal Reserve Banks
ASSETS
|| LIABILITIES
Securities
|| Reserves of banks
Loans to banks
|| Treasury deposits
other
|| Federal Res. Notes
|| other
We will use this balance sheet to see how the Fed uses it three monetary policy tools to change the excess reserves of banks and therefore change the money supply. [See, I said it again.]
The Fed has Four Major "Tools" of Monetary PolicyAs we learned in the previous chapter, if banks gain excess reserves then the money supply will increase and if banks lose excess reserves than the money supply will decrease. So, the way that the Fed controls the money supply is by controlling the excess reserves of banks. Each of the four tools of the Fed do this.
Three tools of the fed:
1. OMO - Open market operations refer to the Fed's buying and selling of government bonds
2. RR - It is the fraction of reserves required relative to their customer deposits.
3. DR - Definition: the interest rate that the Fed charges to commercial banks that borrow from the Fed.
4. Term Auction Facility - very similar to the discount rate (DR)1. Open market operations are most important. This decision is flexible because securities can be bought or sold quickly and in great quantities. Reserves change quickly in response.
2. The reserve ratio is rarely changed since this could destabilize bank's lending and profit positions.
3. Changing the discount rate has become a passive tool of monetary policy. The Fed sets their target for the Federal funds rate, and then sets the discount rate at 1 percentage point above that target.
4. The Term Auction Facility was introduced in December 2007 in response to mortgage debt crisis.Let's look at how each tool works one at a time.
Open Market Operations (OMO)
For several reasons, open market operations give the Fed most control over the money supply of the three "tools" and therefore it is the tool most often used. If you ever read an article in the newspaper that says "the fed lowered interest rates yesterday", it really means the fed used its Open Market Operations to BUY bonds which increased the excess reserves of banks and therefore bank have more lending ability and the money supply will increase.Open market operations refer to the Fed's buying and selling of government bonds.
1. Buying securities will increase bank reserves and the money supply.a. If the Fed buys directly from banks, then bank reserves go up by the value of the securities sold to the Fed. See impact on balance sheets using text example.b. If the Fed buys from the general public, people receive checks from the Fed and then deposit the checks at their bank. Bank customer deposits rise and therefore bank reserves rise by the same amount. Follow text example to see the impact.
i. Banks' lending ability rises with new excess reserves.ii. Money supply rises directly with increased deposits by the public.
c. When Fed buys bonds from bankers, reserves rise and excess reserves rise by same amount since no checkable deposit was created.
d. When Fed buys from public, some of the new reserves are required reserves for the new checkable deposits.
e. Conclusion: When the Fed buys securities, bank reserves will increase and the money supply potentially can rise by a multiple of these reserves.
f. Note: When the Fed sells securities, points a e above will be reversed. Bank reserves will go down, and eventually the money supply will go down by a multiple of the banks' decrease in reserves.
g. How the Fed attracts buyers or sellers:
i. When Fed buys, it raises demand and price of bonds, which in turn lowers effective interest rate on bonds. The higher price and lower interest rates make selling bonds to Fed attractive.ii. When Fed sells, the bond supply increases and bond prices fall, which raises the effective interest rate yield on bonds. The lower price and higher interest rates make buying bonds from Fed attractive.
2. buying securities
Buying securities will increase bank reserves and the money supplya. Example: Assume that the Fed buys a $1000 bond (security) from a commercial bank (RR = 20%)1) then bank reserves go up by the value of the securities sold to the Fed.2) impact on balance sheets:
|
|
|||||||||||||||||||||||||||||||||||
|
|
|
|||||||||||||||||||||||||||||||||||
|
3) The CHANGES to the Fed's balance sheet will be:
- Gain $1000 billion in assets
- The Fed pays the commercial banks by created their accounts (deposits). - Remember: all banks whether directly or via another bank have deposits at fed . This is an additional liability for the Fed
4) The CHANGES to the bank's balance sheets will be more excess reserves increases Bank's lending ability -- remember when banks make loans they create money
To calculate the changes in the bank's excess reserves:
- Total Reserves = cash in vault + Deposits at Fed. = +$1000
- Required Reserves = RR x Liabilities = .20 x 0 = 0
(NOTE: since there are no changes in liabilities, there are no changes in required reserves.)- Excess Reserves = Total Reserves - Required Reserves = 1000 - 0 = 1000
- When Fed buys bonds from bankers, reserves rise and excess reserves rise by same amount since no checkable deposit was created.
5) So what happens to the money supply?
Total change in the money supply (from chapter 15):
MS = initial ER x money multiplier
- money multiplier = 1 / RR = 1/.2 = 5
- SO:
6) Textbook Figure 16.2
b. Example: Assume that the Fed buys a $1000 bond (security) from the general public (RR = 20%)
1) people receive checks from the Fed and then deposit the checks at their bank. Bank customer's deposits rise and therefore bank reserves rise by the same amount. NOTE: this $1000 in new demand deposits is NEW MONEY2) impact on balance sheets
The CHANGES to the Fed's balance sheet will be:
- Gain $1000 billion in assets
- The Fed pays the public and they deposit it in their bank (see balance sheet below). When the check clears the Fed credits the bank's account This is an additional liability for the Fed
|
|
|||||||||||||||||||||||||||||||||||
|
|
|
|||||||||||||||||||||||||||||||||||||||
|
3) The CHANGES to the bank's balance sheets will be:Banks’ lending ability rises with new excess reserves of $800. When Fed buys from public, some of the new reserves are required reserves for the new checkable deposits.
4) Total change in the money supply (from chapter 14):
- money multiplier = 1 / RR = 1/.2 = 5
- SO:
- PLUS the initial $1000 of new money created when the fed paid the public for the gov't security = $ 5000
4) Textbook Figure 16.2
c. Conclusion:
When the Fed buys securities, bank reserves will increase and the money supply potentially can rise by a multiple of these reserves.The Fed pays for the securities with new Excess Resources (ER)
OR
The Fed would do this to fight unemployment (UE)
3. When the Fed sells securities:
a. the points above will be reversed.b. Bank reserves will go down, and eventually the money supply will go down by a multiple of the banks’ decrease in reserves.
c. they would do this to fight inflation (IN)
|
Four tools of the fed: 1. OMO |
Changing the Reserve Ratio (RR)
The reserve ratio is another "tool" of monetary policy. It is the fraction of reserves required relative to their customer deposits.1. Raising the reserve ratio increases required reserves and shrinks excess reserves. Any loss of excess reserves shrinks banks' lending ability and, therefore, the potential money supply by a multiple amount of the change in excess reserves.2. Lowering the reserve ratio decreases the required reserves and expands excess reserves. Gain in excess reserves increases banks' lending ability and, therefore, the potential money supply by a multiple amount of the increase in excess reserves.
3. Changing the reserve ratio has two effects.
a. It affects the size of excess reserves.b. It changes the size of the monetary multiplier. For example, if ratio is raised from 10 percent to 20 percent, the multiplier falls from 10 to 5.
4. Changing the reserve ratio is very powerful since it affects banks' lending ability immediately. It could create instability, so Fed rarely changes it.
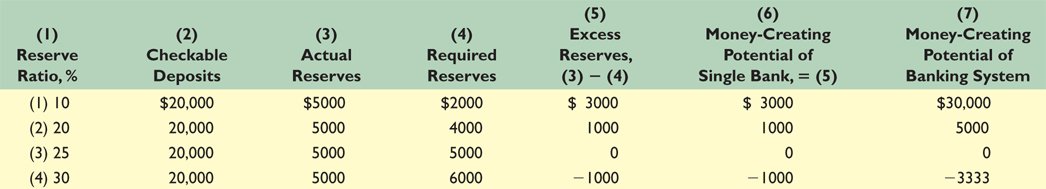
5. Table 16.2 provides illustrations.
1. raising the reserve ratio
a. Raising the reserve ratio increases required reserves and shrinks excess reserves.b. Any loss of excess reserves shrinks banks’ lending ability and, therefore, DECREASES the potential money supply by a multiple amount of the change in excess reserves.
2. lowering the reserve ratio
a. Lowering the reserve ratio decreases the required reserves and expands excess reserves.b. Gain in excess reserves increases banks’ lending ability and, therefore, INCREASES the potential money supply by a multiple amount of the increase in excess reserves.
3. EXAMPLE: What happens if the fed lowers the RR from 20% to 10% ?
Initially assume
- RR = 20%
- and the banking system has the following balance sheet
|
|
|||||||||||||||||||||||||||||
|
What is the potentialFormulas:
- ER = Total Reserves - Required Reserves
- money multiplier = 1/RR
- Required Reserves = RR x Liabilities
Solution:
- Required Reserves = RR x Liabilities = .2 x $ 100,000 = $ 20,000
- ER = Total Reserves - Required Reserves = $25,000 - $ 20,000 = $ 5,000
- money multiplier = 1 / RR = 1/0.2 = 5
ANSWER: MS can increase by $ 25,000
What happens if the Fed LOWERS the DR to 10%?
Now:
- RR = 10%
- initially the banking system has the following balance sheet
|
|
|||||||||||||||||||||||||||||
|
What is the potentialFormulas:
- ER = Total Reserves - Required Reserves
- money multiplier = 1/RR
- Required Reserves = RR x Liabilities
Solution:
- Required Reserves = RR x Liabilities = .1 x $ 100,000 = $ 10,000
- ER = Total Reserves - Required Reserves = $25,000 - $ 10,000 = $ 15,000
- money multiplier = 1 / RR = 1/0.1 = 10
ANSWER: MS can increase by $ 150,000
4. Changing the reserve ratio has two effects:
a. It affects the size of excess reserves.b. It also changes the size of the monetary multiplier. For example, if ratio is lowered from 20 percent to 10 percent, the multiplier increases from 5 to 10.
5. Changing the reserve ratio is very powerful since it affects banks’ lending ability immediately. It could create instability, so Fed rarely changes it.
6. Table 16-2 provides illustrations.
|
Four tools of the fed: 1. OMO |
Discount Rate
The third "tool" is the discount rate, which is the interest rate that the Fed charges to commercial banks that borrow from the Fed.1. An increase in the discount rate signals that borrowing reserves is more difficult and will tend to shrink excess reserves.2. A decrease in the discount rate signals that borrowing reserves will be easier and will tend to expand excess reserves.
1. Definition: the interest rate that the Fed charges to commercial banks that borrow from the Fed.
2. An increase in the discount rate signals that borrowing reserves is more difficult and will tend to shrink excess reserves.
3. A decrease in the discount rate signals that borrowing reserves will be easier and will tend to expand excess reserves.
|
Four tools of the fed: 1. OMO |
Term Auction Facility
The fourth tool is a new tool, but very similar to changing the discount rate1. This tool was introduced in December 2007 in response to mortgage debt crisis.2. Under the term auction facility, the Fed holds two auctions each month.
3. Banks bid for the right to borrow reserves for 28 days
- Fed Decides how many reserves they want to lend
- Banks bid on what interest rate they are willing to pay to borrow these reserves
- Banks accepts all highest bids until the reserves are lent
- and then charges all the winning bidders the rate of the lowest bid
4. Unlike the discount rate where the Fed sets the rate and then sees how many reserves bank borrow, with the term auction facility the Fed sets the amount of reserves that it wants banks to borrow and then will let banks make bids on how much they will borrow and at what discount rate.
The Federal funds rate is the interest rate that banks charge each other for overnight loans. You will often hear it mentioned in news reports.Banks lend to each other from their excess reserves, but because the Fed is the only supplier of Federal funds (the currency used as reserves), it can set the Federal funds rate and then use open-market operations to make sure that rate is achieved.
1. The Fed will increase the availability of reserves if it wants the Federal funds rate to fall (or keep it from rising).2. Reserves will be withdrawn if the Fed wants to raise the Federal funds rate (or keep it from falling).
The Fed may use an expansionary monetary policy if the economy is experiencing a recession and rising rates of unemployment.
1. The Fed will initially announce a lower target for the Federal funds rate, then use open-market operations (buying bonds in this case). The Fed may also lower the reserve ratio or the discount rate.2. Increasing reserves will generate two results:
a. The supply of Federal funds will increase, lowering the Federal funds rate.b. Through the money multiplier process, a greater expansion of the money supply will occur. (See Chapter 12 for a refresher on that process)
3. Expansionary monetary policy will put downward pressure on interest rates, including the prime interest rate - the benchmark interest rate used by banks to set many other interest rates.
Restrictive monetary policy is used to combat rising inflation.
1. The initial step is for the Fed to announce a higher target for the Federal funds rate, followed by the selling of bonds to soak up reserves. Raising the reserve ratio and/or discount rate is also an option.2. Reducing reserves will produce results opposite of what we saw for an expansionary monetary policy.
a. The reduced supply of Federal funds will raise the Federal funds rate to the new target.b. Multiple contraction of the money supply, through the money multiplier process (Chapter 12).
3. Restrictive monetary policy results in higher interest rates, including the prime rate.
E. Consider This … The Fed as a Sponge
If reserves in the banking system are like a bowl of water, the Fed can use open-market operations as a sponge that can change the amount of water (reserves) in the bowl.1. If there are too many reserves, the Fed "soaks up" the excess by selling bonds.
2. If the Fed wants more reserves in the system, it "squeezes the sponge" by buying bonds.
F. The Taylor Rule - Stanford economist John Taylor has proposed a rule for targeting the Federal funds rate. It assumes a target inflation rate of 2% and has three components:
1. If real GDP rises by 1 percent above potential, the Federal funds rate should be raised by one-half a percentage point.2. If inflation rises by 1 percentage point above its target, the Federal funds rate should be raised by one-half a percentage point.
3. When real GDP is at its potential and inflation is at its target, the Federal funds rate should be at 4% (implying a real interest rate of 2%).
4. The rules work in reverse as well, if real GDP is below its potential and inflation is below the 2% target.
5. While the Fed has roughly followed the Taylor rule in recent years, it has also deviated under certain circumstances (e.g. the threat of deflation)
SUMMARY:
If you hear on the news that the Fed has lowered the Fed Funds rate, that means the Fed is BUYING securities on the open market to increase bank reserves and increase the money supply, i.e. they are fighting unemployment .
If you hear on the news that the Fed has raised the Fed Funds rate, that means the Fed is SELLING securities on the open market to decrease bank reserves and decrease the money supply, i.e. they are fighting inflation.
A. Cause effect chain:1. Money market impact is shown in Key Graph 16.5.a. Supply of money is assumed to be set by the Fed.b. Interaction of supply and demand determines the market rate of interest, as seen in Figure 16.5a.
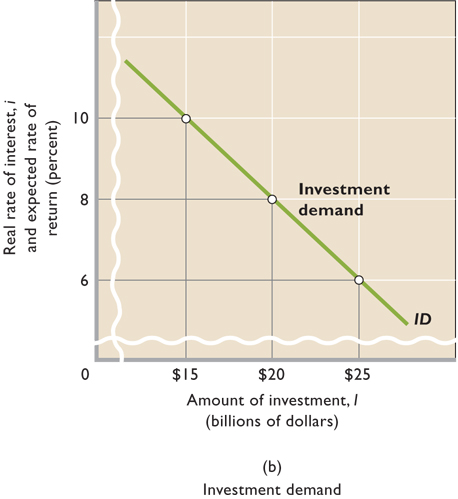
c. Interest rate determines amount of investment businesses will be willing to make. Investment demand is inversely related to interest rates, as seen in Figure 16.5b.
d. Effect of interest rate changes on level of investment is great because interest costs of large, long-term investment is a sizable part of investment cost.
e. As investment rises or falls, AD changes and the equilibrium GDP rises or falls by a multiple amount, as seen in Figure 16.5c.
2. Expansionary monetary policy: The Fed takes steps to increase excess reserves, which lowers the interest rate and increases investment which, in turn, increases aggregate demand and real GDP. (See Column 1, Table 16.3)
3. Restrictive monetary policy is the reverse of an expansionary monetary policy: Excess reserves fall, which raises interest rate, which decreases investment, which, in turn, reduces aggregate demand and inflation. (See Column 2, Table 16.3)
Monetary Policy and the Monetary Policy Cause Effect Chain (graphs)
Keynesian Cause-Effect Chain of Monetary Policy:
FED
TOOLS
Term Auction Facility"Easy" or expansionary monetary policy
HOW EXPANSIONARY MONETARY POLICY WORKS: Easy money policy, or expansionary monetary policy, designed to decrease unemployment:
FED
TOOLSER
Int. Rates
BUY OMO
lend more reserves through the term auction facility
1. occurs when the Fed tries to increase money supply by expanding excess reserves in order to stimulate the economy.2. The Fed will enact one or more of the following measures.
a. The Fed will buy securities.b. The Fed may reduce reserve ratio, although this is rarely changed because of its powerful impact.
c. The Fed could reduce the discount rate, although this has little direct impact on the money supply.
d. the Fed could lend more reserves through the Term Auction Facility
3. Expansionary or easy money policy: The Fed takes steps to increase excess reserves, banks can make more loans increasing the money supply, which lowers the interest rate and increases investment which, in turn, increases GDP by a multiple amount of the change in investment.
"Tight" or contractionary monetary policy
|
|
FED SELL OMO |
|
|
1. occurs when Fed tries to decrease money supply by decreasing excess reserves in order to slow spending in the economy during an inflationary period.2. The Fed will enact one or more of the following policies:
a. The Fed will sell securities.b. The Fed may raise the reserve ratio, although this is rarely changed because of its powerful impact.
c. The Fed could raise the discount rate, although it has little direct impact on money supply.
d. The Fed could lend fewer reserves through the Term Auction Facility
3. Contractionary or tight money policy is the reverse of an easy policy: Excess reserves fall, the money supply decreases, which raises interest rate, which decreases investment, which, in turn, decreases GDP by a multiple amount of the change in investment.
Keynesian Cause-Effect Chain of Monetary
Policy: FED
TOOLS ![]()
![]() ER
ER![]()
![]() MS
MS
![]()
![]() Int.
Rates
Int.
Rates![]()
![]() I
I
![]()
![]() AD
AD
![]()
![]()
![]() real
GDP
real
GDP ![]()
![]() UE
and
UE
and ![]() EG
EG
![]() PL
PL
![]()
![]() IN
IN![]() OMO
OMO
![]() DR
DR
![]() RR
RR
Term Auction Facility
C. Textbook Graph (figure 16.5)
Graph 1 Graph 2 Graph 3

1. Using the textbook's "Key Graph 15.2", how would we illustrate expansionary MP?a. If the MS is Sm1 in graph 1
- so the equilibrium interest rate is 10% (graph 1)
- with a 10% interest rate the initial amount of investment is $15 billion (graph 2)
- with I = $15 billion the initial AD is AD1 (graph 3)
b. Fed either:
- buys securities
- lowers the DR
- lowers the RR
c. this increases ER and increases the MS from Sm1 to Sm2 (graph 1)
d. interest rates fall from 10% to 8% (graph 1)
e. when interest rates fall, the amount of I increases from $15 billion to $20 billion (graph 2)
f. this $5 billion increase in investment will increase AD from AD1 to AD2 (graph 3)
g. THEREFORE, real GDP increases from Q1 to Qf
h. Review chapter 9.
- if Q1 = $400 billion
- and if MPC = 0.8
- what is Qf?
2. Using the textbook's "Key Graph 15.2", how would we illustrate contractionary MP?
a. If the MS is Sm3 in graph 1
- so the equilibrium interest rate is 6% (graph 1)
- with a 10% interest rate the initial amount of investment is $25 billion (graph 2)
- with I = $25 billion the initial AD is AD3 (graph 3)
b. Fed either:
- sells securities
- raises the DR
- raises the RR
c. this decreases ER and decreases the MS from Sm3 to Sm2 (graph 1)
d. interest rates rise from 6% to 8% (graph 1)
e. when interest rates rise, the amount of I decreases from $25 billion to $20 billion (graph 2)
f. this $5 billion decrease in investment will decrease AD from AD3 to AD2 (graph 3)
g. THEREFORE, real GDP decreases from Q3 to Qf
h. Review chapter 9.
- if Q1 = $450 billion
- and if MPC = 0.8
- what is Qf?
D. For several reasons, open-market operations give the Fed most control of the four "tools."
1. Open-market operations are most important.
- This decision is flexible because securities can be bought or sold quickly and in great quantities.
- Reserves change quickly in response.
2. The reserve ratio is rarely changed since this could destabilize bank’s lending and profit positions.
3. Changing the discount rate has little direct effect,
- since only 2-3 percent of bank reserves are borrowed from Fed.
- At best it has an "announcement effect" that signals direction of monetary policy.
E. SUMMARY: Monetary Policies for Recession and Inflation -- TABLE 16.3
E. Quick Quiz 15-2.
A. Strengths of monetary policy:
B. Recent monetary policy
C. Problems and complications:
Strengths of monetary policy:
1. It is speedier and more flexible than fiscal policy since the Fed can buy and sell securities daily.2. It is less political. Fed Board members are isolated from political pressure, since they serve 14 year terms, and policy changes are more subtle and not noticed as much as fiscal policy changes. It is easier to make good, but unpopular decisions.
Effectiveness of Monetary PolicyA. Changes in the price level changes the effectiveness of monetary policy
1. Easy monetary policy may be inflationary if initial equilibrium is at or near full-employment. (AD3 to AD4)2. If economy is below full-employment, easy monetary policy can shift aggregate demand and GDP toward full-employment equilibrium. with little effect on inflation (AD1 to AD2)
3. A tight monetary policy can reduce inflation with little effect on unemployment if economy is near or above full-employment (AD6 to AD5)
4. A tight monetary policy can make unemployment worse in a recession. (AD2 to AD1)
Recent monetary policy
1. Expansionary monetary policy in the early 1990s helped produce recovery from the 1990-1991 recession and the expansion that lasted until 2001. Tightening in 1994, 1995, 1997, 1999, and 2000, helped ease inflationary pressure during the expansion.2. To counter the recession that began in March 2001, the Fed pursued an easy money policy that saw the prime interest rate fall from 9.5 percent at the end of 2000 to 4.25 percent in December 2002.
3. The Fed has been praised for helping the U.S. economy maintain simultaneously full employment, price stability, and economic growth for over four years. They have also received credit for swift and strong responses to the September 11, 2001, terrorist attacks, significant declines in the stock market, and the overall recessionary conditions.
4. In response to strong economic growth in 2004, the Fed began a series of quarter-percentage-point increases in the Federal Funds rate. Those increases have continued well into 2006.
Problems and complications:
1. LAGS - Recognition and operational lags impair the Fed's ability to quickly recognize the need for policy change and to affect that change in a timely fashion.
- Although policy changes can be implemented rapidly (short administrative lag), there is a lag of at least 3 to 6 months before the changes will have their full impact.
2. CYCLICAL ASYMMETRY may exist: a tight monetary policy works effectively to brake inflation, but an easy monetary policy is not always as effective in stimulating the economy from recession.
- Japan's ineffective easy money policy illustrates the potential inability of monetary policy to bring an economy out of recession. While pulling on a string (tight money policy) is likely to move the attached object to its desired destination, pushing on a string is not.
3. CHANGES IN VELOCITY: The velocity of money (number of times the average dollar is spent in a year) may be unpredictable, especially in the short run and can offset the desired impact of changes in money supply. Tight money policy may cause people to spend faster; velocity rises.
4. The IMPACT ON INVESTMENT may be less than traditionally thought. Japan provides a case example. Despite interest rates of zero, investment spending remained low during the recession.
Also see: http://money.cnn.com/2003/06/11/news/economy/borrowing_slump/index.htm