WE ALREADY KNOW: If there is UE? |
WE
ALREADY KNOW: If
there is IN? A. Review : Fiscal
Policy 2. Fiscal Policy
tools 3. Expansionary
Fiscal Policy 4. Contractionary
Fiscal Policy
If
there is UE?
1.
Definition: discretionary
fiscal policy
Deliberate
changes in taxes (tax rates) and government
spending by Congress to promote full-employment,
price stability, and economic growth.
a.
government purchases (spending)
b. taxes
c. both
In this chapter we will look at how effective various fiscal policy tools are - or , put another way, we will the multiplier effect of various fiscal policy options. If a fiscal policy tool that has a larger multiplier effect is more effective at reducing unemployment or inflation. A tool that has a smaller multiplier effect is less effective. The table below outlines the various fiscal policy tools / multipliers.
MULTIPLIER
PAGE
LARGER OR SMALLER THAN
THE SIMPLE MULTIPLIER? - WHY?SIMPLE
p. 158-161 "The Multiplier Effect"
multiplier = 1 / MPS
Complex multiplier
p. 162
"How Large is the Actual Multiplier Effect?"smaller because there are more leakages: (1) saving, (2) spending on imports, and (3) taxes; fiscal policy is less effective
Multiplier w/ changes
in the price levelp. 162 "How Large is the Actual Multiplier Effect?"
smaller than the simple multiplier; fiscal policy is less effective
G spending multiplier
p. 209 "Increased Government Spending"
p. 211 "Decreased Government Spending"same as the simple multiplier assuming no inflation and no imports
Tax multiplier
p. 210 "Tax Reductions"
p. 211 "Increased Taxes"one less than the simple multiplier, but negative
tax multiplier =MPC / MPS
less effective than the simple multiplierBalanced Budget multiplier
p. 210, 211 "Combined Gov/t Spending . . . "
always equals 1, WHY?; less effective than the simple multiplier or the tax multiplier
Multiplier w/ crowding out
(expansionary FP only)p. 217-218 "Crowding-Out Effect"
smaller than the simple multiplier; fiscal policy is less effective
Multiplier with supply-side effects
pp. 295-299 "Taxation and Aggregate Supply"
pp. 218 "Current Thinking on Fiscal Policy"
larger than the simple multiplier; fiscal policy is more effective
The Government Spending Multiplier
Now let's add government to our model.
GDP
=
C
+
I
+
G
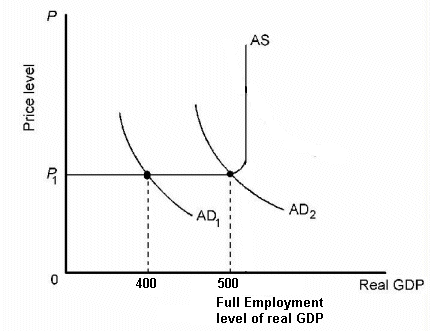
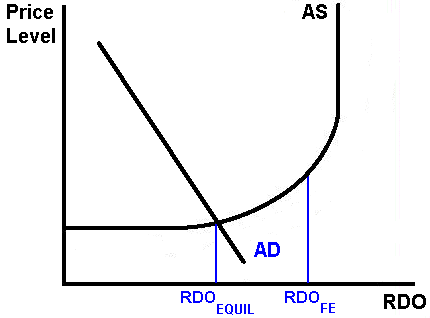
Use these graphs to answer the questions that follow
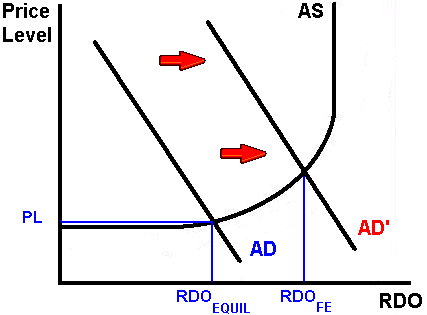
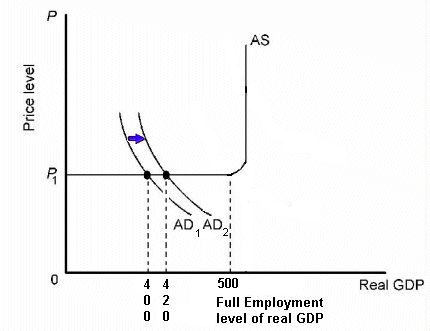
Our overall goal is to learn HOW MUCH the government has to change spending or taxes to achieve full employment.
- What is the MPC? ______________
- What is the MPS? ______________
- What is the current equilibrium level of output in this economy? ______________
- What level of output can be achieved if this economy had full employment? _____________
ANSWERS:
1. 0.8
2. 0.2
3. $400
4. $500- What change in government spending is needed to achieve full employment? NOW WE ARE READY TO LEARN THE ANSWER TO THIS IMPORTANT QUESTION.
OPTIONAL: Marginal Propensities to Consume and to Save
We know that a small initial change in spending will result in a multiplied effect on total spending in the economy, or:
change in GDP
=
initial change in spending
x multiplier
So to answer question # 5 above we have:
change in GDP
=
initial change in spending
x multiplier
+ $100
=
increase G by ?
x ? If we knew what the multiplier was, we could easily calculate the change in government spending needed to increase GDP by $100 and achieve full employment.
1 1 multiplier =
-------- or ----------
MPS 1 - MPC
So:
1 1 multiplier =
-------- = ---------- =
5
MPS 0.2 And:
change in GDP
=
initial change in spending
x multiplier
+ $100
=
increase G by ?
x 5 and the increase in government spending needed to increase GDP by $100, and therefore achieve full employment, is $20.
change in GDP
=
initial change in spending
x multiplier
+ $100
=
increase G by 20
x 5 + $100
=
20
x 5 The Multiplier and Marginal Propensities
Notice that the size of the multiplier is inversely related to the size of the MPS. If the MPS is larger, the multiplier is smaller. This should make sense to you if you recall how the multiplier works. We said: "an initial change in spending will cause an initial increase in GDP and it also becomes income to someone else. (If I buy a new car, people who built and sold that car earn income equal to the price of the car.) What will these people do with their additional income? Well, they will spend some and save some. The amount that they spend increases GDP even more AND it also becomes income to someone else." So. if the MPS is larger (and the MPC is smaller) then the amount of additional income that is spent will be smaller and this will cause a smaller increase in GDP and a smaller increase in income to somebody else. Any time that more is saved and less is spent, GDP goes up by less.
You may want to try different MPC's and MPS's and see if this is true using the formulas below:
1 1 multiplier =
-------- or ---------- MPS 1 - MPC The Multiplier Graphically
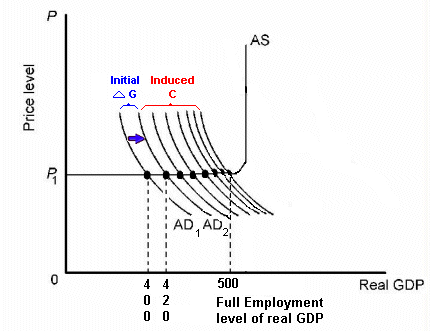
How does the multiplier effect look on our AS-AD graph? Here is our initial graph:
When spending (G) initially increases by $20 AD shifts to the right $20.
Then income increases by $20 and we get $16 in induced consumption.
This increases income by an additional $16 which increase induced consumption by $12.8 and so on until savings equals $20 and there is nothing left to spend. The total change in GDP equals $100. this is the initial $20 in government spending and a total of $80 in induced consumption.
Review of Important Formulas
change in C
MPC =
-----------------
change in income
change in S
MPS =
-----------------
change in income
This is the central goal of this lesson. This is the concept that we are trying to understand!
change in GDP
=
(initial change in spending)
x (multiplier)
1 1 multiplier =
-------- or ---------- MPS 1 - MPC
The Lump-Sum Tax Multiplier
There are three fiscal policy tools:
- change government spending (
G)
- change taxes (
- a balanced budget change which is changing both government spending and taxes by the same amount and in the same direction (
BB)
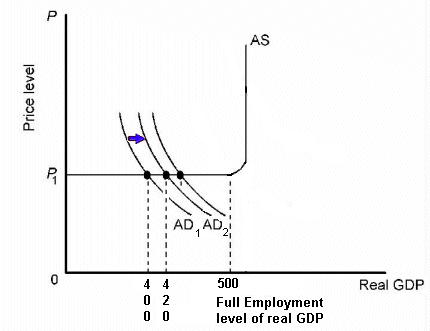
Here, let's use the same data that we have been using to see by HOW MUCH taxes should be changed when using fiscal policy.
Use these graphs to answer the questions that follow
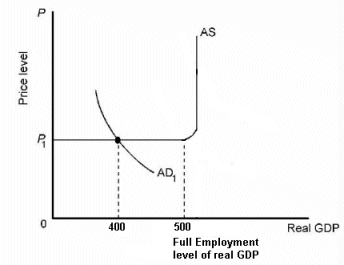
Our goal is to learn by HOW MUCH the government should change taxes to achieve full employment. We know from our AD-AS lesson that if taxes are decreased this increases consumption and increases AD. Our question here is if we want to achieve the full employment level of GDP in the economy illustrated in the graphs above (full employment GDP = $500), by HOW MUCH should taxes be cut?
- What is the MPC? ______________
- What is the MPS? ______________
- What is the current equilibrium level of output in this economy? ______________
- What level of output can be achieved if this economy had full employment? _____________
ANSWERS:
1. 0.8
2. 0.2
3. $400
4. $500
- What change in taxes is needed to achieve full employment?
NOW WE ARE READY TO LEARN THE ANSWER TO THIS IMPORTANT QUESTION.We know that a small initial change in spending will result in a multiplied effect on total spending in the economy, or:
change in GDP
=
change in taxes
x lump-sum tax multiplier
So to answer question # 5 above we have:
change in GDP
=
change in taxes
x lump-sum tax multiplier
+ $100
=
decrease T by ?
x ? If we knew what the lump-sum tax multiplier was, we could easily calculate the change in taxes needed to increase GDP by $100 and achieve full employment.
First, what is a "lump-sum tax"?
To make things easier for us we will discuss "lump-sum taxes" rather then the much more common income tax. A lump-sum tax is a "tax per person" and it does not change with income. for example if the lump-sum tax was $500 per person I would have to pay $2000 for my family of four regardless of my income.
Next, we know that if taxes are cut, this will increase disposable income and therefore increase consumption:
T Þ
DI Þ
The question we have here is HOW MUCH? Let's say they decrease taxes by $25. this then will increase disposable income (spendable income) by $25. If consumers have an additional $25 to spend consumption will go up by how much?
T What tells us the change in consumption that results from a change in income? . . . MPC!!!
If MPC = 0.8 then if disposable income increases by $25, consumption will increase by $20change in consumption = (MPC) x (change in income) change in consumption = (0.8) x ($25)
change in consumption = $20
So what happens to GDP with the multiplier effect?
change in GDP
= (initial change in spending) x (multiplier) ? = + $20 x 5 So when we cut taxes by $25, GDP increased by $100. What is the lump-sum tax multiplier?
change in GDP = change in taxes x lump-sum tax multiplier + $100 = decrease T by $25 x ? + $100 = decrease T by $25 x - 4 So the lump sum tax multiplier is equal to -4.
There are two ways to calculate the lump-sum tax multiplier:
- MPC lump-sum tax multiplier = -------------- MPS
- 0.8 lump-sum tax multiplier = -------------- = - 4 0.2 and
The lump-sum tax multiplier is always negative and
ONE LESS THAN THE SIMPLE MULTIPLIER.So in this example our simple multiplier is:
1 1 multiplier =
-------- = -------- = 4 MPS 0.8 So the lump-sum tax multiplier is -4.
The Balanced Budget Multiplier
There are three fiscal policy tools:
- change government spending (
- change taxes (
- a balanced budget change which is changing both government spending and taxes by the same amount and in the same direction (
What happens if the government changes BOTH government spending AND taxes by the SAME AMOUNT And in the SAME DIRECTION?
We call this a "balanced-budget change". IT DOES NOT BALANCE THE FEDERAL BUDGET, but it doesn't make it any more unbalanced. If there is high unemployment and the government uses expansionary fiscal policy to try to reduce the unemployment they would increase government spending and/or decrease taxes. If they do this, spending goes up and tax revenues go down so this would lean to a budget deficit where they are spending more than they take in as taxes. Many people do not what the government to deficit spend.
So let's go back to our example and see what the government can do to reduce unemployment without creating a (larger) deficit. Use these graphs to answer the questions that follow.
Our goal is to learn by HOW MUCH the government should change taxes to achieve full employment. We know from our AD-AS lesson that if taxes are decreased this increases consumption and increases AD. Our question here is if we want to achieve the full employment level of GDP in the economy illustrated in the graphs above (full employment GDP = $500), by HOW MUCH should taxes be cut?
- What is the MPC? ______________
- What is the MPS? ______________
- What is the current equilibrium level of output in this economy? ______________
- What level of output can be achieved if this economy had full employment? _____________
ANSWERS:
1. 0.8
2. 0.2
3. $400
4. $500
- What balanced-budget change is needed to achieve full employment?
NOW WE ARE READY TO LEARN THE ANSWER TO THIS IMPORTANT QUESTION.
So let's go back to our example and see what the government can do to reduce unemployment without creating a (larger) deficit. What balanced-budget change (changing both government spending and taxes by the same amount and in the same direction) could the government undertake to increase GDP in this economy by $100 and thereby achieve full employment?
change in GDP = (balanced-budget change in spending) x (balanced-budget multiplier) + $100 = (change G and T by ?)
x ? What would happen if we increase G by $100 AND increase T by $100? If we increase G, this will increase GDP, but if we increase T, this will decrease GDP. If we do both, what happens?
.
.
.
It depends on HOW MUCH GDP changes.
So lets increase G and T both by $100. What happens?
Increase G by $100:
change in GDP = (initial change in spending) x (multiplier) + $500
=
increase G by 100
x 5 RESULT: GDP goes up by $500
Increase T by $100:
change in GDP = change in taxes x lump-sum tax multiplier - $400 = increase T by $100 x -4 RESULT: GDP goes down by $400
Back to our example: What balanced-budget change (changing both government spending and taxes by the same amount and in the same direction) could the government undertake to increase GDP in this economy by $100 and thereby achieve full employment?
So, if the government does both, GDP will go up by $500 and down by $400 for a net change of
+ $100.What is the balanced-budget multiplier?
The balanced-budget multiplier is always a 1. This is because the lump-sum tax multiplier is always one less than the simple (or government spending) multiplier.
change in GDP = (balanced-budget change in spending) x (balanced-budget multiplier) + $100 = (change G and T by $100)
x ? + $100 = x 1
Multiplier with Crowding Out
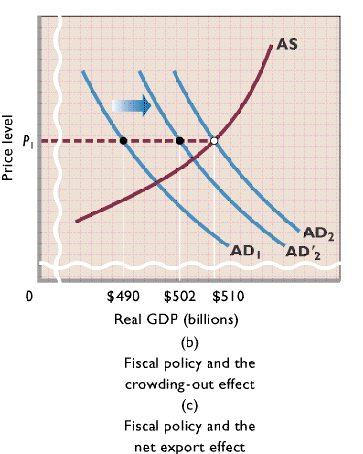
The crowding-out effect may be caused by fiscal policy.a. REVIEW MULTIPLIERSb. DEFINITION: Crowding Out Effect
A rise in interest rates and a resulting decrease in planned investment caused by the Federal government’s increased borrowing in the money market.c. "Crowding-out" may occur with government deficit spending.
It may increase the interest rate and reduce private spending which weakens or cancels the stimulus of fiscal policy. (See Figure 12-5)
d. Some economists argue that little crowding out will occur during a recession.
e. Economists agree that government deficits should not occur at FE.,
f. it is also argued that monetary authorities could counteract the crowding-out by increasing the money supply to accommodate the expansionary fiscal policy.
Multiplier with Supply-Side Effects (pp. 2-2)
A. What is "Supply-Side FP" ?1. The contention that tax reductions will also shift the aggregate supply curve to the right.
(see the graph below).2. There are three main reasons for this:
a. Saving and investment -
- lower taxes will increase disposable incomes,
- thereby increasing household savings,
- lowering interest rates,
- and increase investment in new technology
- new technology increases productivity and,
- therefore shift aggregate supply to the right
b. Work incentives –
- lower tax rates will increase after tax wages from work,
- thereby increasing work incentives and productivity,
- therefore, shift aggregate supply to the right.,
c. Risk Taking –
- lower tax rates prod risk taking individuals and businesses to risk their energy and financial capital on new production methods and new products and,
- therefore, shift aggregate supply to the right.
B. Effect on the multiplier - REVIEW MULTIPLIERS
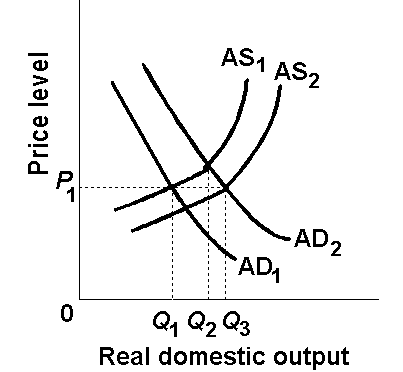
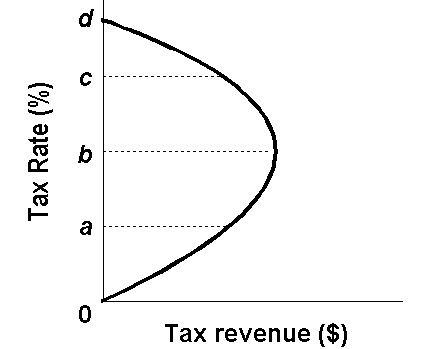
Larger multiplier: instead of going from Q1 to Q2 (simple multiplier) the economy goes to Q3C. Supply side economists sometimes argue that if lower taxes raise GDP, tax revenues may actually rise.
Laffer Curve
D. Many economists are skeptical of supply-side theories.
1. Effect of lower taxes on a supply is not supported by evidence.2. Tax impact on supply takes extended time, but demand impact is more immediate.
The Multiplier with Changes in the Price Level
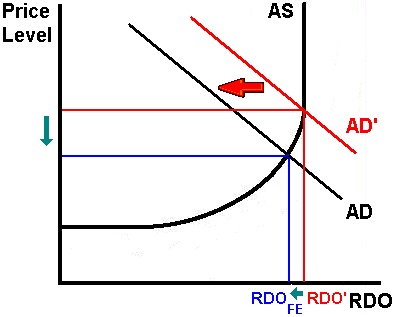
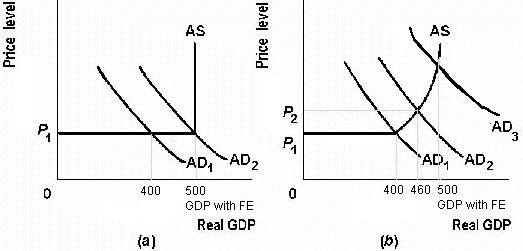
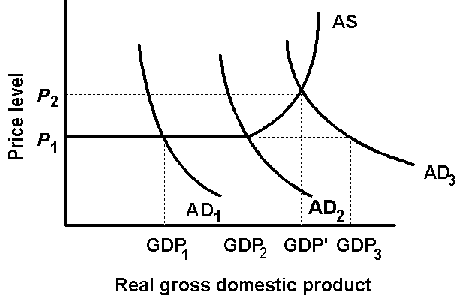
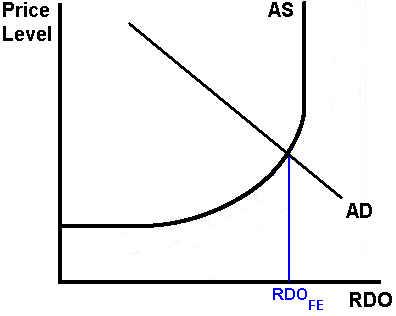
We have been assuming that the price level does not change as AD increases (see graph).
But in the real world as GDP increases and approaches the full employment level of output the price level will begin to rise and resource costs increase.
How does this inflation, which results from an increase in AD, affect the size of the multiplier? Or, what happens to the change in government spending needed to achieve full employment if we allow for inflation? Without inflation, and with an MPC of 0.8, if we increase government spending by $20 then GDP will increase by $100. the multiplier is 4. This will shift AD from AD1 to AD2 in both graphs above. In graph (a) without inflation the equilibrium GDP increases from $400 to $500. But in graph (b) with inflation the same horizontal shift in AD increases GDP from $400 to only $460. From the same change in government spending ($20) GDP increases a small amount. the multiplier is smaller.
To calculate the multiplier with changes in the price level you need to know the initial change in spending ($20 in our example) and the resulting total change in GDP ($60 from graph b above).
change in GDP = initial change in spending x multiplier + $60 = + $20 x ? + $60 = + $20 x 3
Outline:
What if the economy enters a recession and the government does NOTHING?Taxes are directly related to GDP (income) and Transfer Payments are indirectly related to GDP
Built-in Stabilizer
Tax Progressivity
A. When the economy enters a recession the government could:
- use expansionary FP (discretionary FP)
- do NOTHING (nondiscretionary FP)
B. What if the economy enters a recession and the government does NOTHING what happens?
- If Taxes are directly related to GDP (income),
- and Transfer Payments (welfare) are indirectly related to GDP,
- what happens to AD after entering a recession?
- taxes decrease
- government spending on welfare
- so AD increases even though the government did nothing
C. Built-in Stabilizer
A mechanism which increases government’s budget deficit (or reduces its surplus) during a recession and increases government’s budget surplus (or reduces its deficit) during inflation without any action by policy makers;the tax system is one such mechanism.
D. Tax Progressivity
A tax system wherein the average tax rate (tax revenue/GDP) rises with GDP.The more progressive the tax system, the greater the economy's built-in stability.
What happens to the government budget deficit if it uses expansionary FP?What happens to the government budget deficit if the economy enters a recession and the government does NOTHING?
So, if the government budget deficit increases when the economy enters a recession, does this indicate that the government is doing some SOMETHING (expansionary FP)?
Since deficits increase during recessions whether the government does SOMETHING or NOTHING we cannot use larger deficits as an indicator that the government is doing something.
Therefore, economists have created a the concept of a "full employment budget"
An increase in the full employment budget deficit is an indicator of discretionary expansionary FP
- actual budget
A listing of amounts spent by the Federal government (to purchase goods and services and for transfer payments) and the amounts of tax revenue collected by it in any (fiscal) year.- cyclical deficit
A Federal budget deficit which is caused by a recession and the consequent decline in tax revenues.- full-employment budget
A comparison of the government expenditures and tax collections which WOULD occur if the economy operated at full employment throughout the year.- structural deficit
The extent to which the Federal government’s expenditures exceed its tax revenues when the economy is at full employment (or the extent to which its current expenditures exceed the projected tax revenues which would accrue if the economy were at full employment); also known as a full-employment budget deficit.
Outline
Problems of Timing1. recognition lag
2. administrative lag
3. operational lagPolitical Problems
1. other goals
2. state and local finance
3. expansionary bias
4. a political business cycle?Crowding Out Effect
Fiscal Policy multiplier with inflation
A. Problems of Timing
1. RECOGNITION LAG is the elapsed time between the beginning of recession or inflation and awareness of this occurrence.2. ADMINISTRATIVE LAG is the difficulty in changing policy once the problem has been recognized.
3. OPERATIONAL LAG is the time elapsed between change in policy and its impact on the economy.
B. Political Considerations:
Government has other goals besides economic stability, and these may conflict with stabilization policy.1. A political business cycle may destabilize the economy:Election years have been characterized by more expansionary policies regardless of economic conditions. Some call this a political business cycle:The alleged tendency of Congress to destabilize the economy by reducing taxes and increasing government expenditures before elections and to raise taxes and lower expenditures after elections.
2. State and local finance policies may offset federal stabilization policies.
They are often procyclical, because balanced-budget requirements cause states and local governments to raise taxes in a recession or cut spending making the recession possibly worse.In an inflationary period, they may increase spending or cut taxes as their budgets head for surplus.
3. The crowding-out effect may be caused by fiscal policy.
a. REVIEW MULTIPLIERSb. DEFINITION: Crowding Out Effect
A rise in interest rates and a resulting decrease in planned investment caused by the Federal government’s increased borrowing in the money market.c. "Crowding-out" may occur with government deficit spending.
It may increase the interest rate and reduce private spending which weakens or cancels the stimulus of fiscal policy. (See Figure 12-5)
d. Some economists argue that little crowding out will occur during a recession.
e. Economists agree that government deficits should not occur at FE.,
f. it is also argued that monetary authorities could counteract the crowding-out by increasing the money supply to accommodate the expansionary fiscal policy.
4. Fiscal Policy multiplier with inflation
a. With an upward sloping AS curve, some portion of the potential impact of an expansionary fiscal policy on real output may be dissipated in the form of inflation.b. Graph
Explain the five problems, criticisms, or complications that arise in the implementation of fiscal policy.
First there is a timing problem. Three lags are identified under the "timing problem" category. There is a lag in recognizing the phase of the business cycle; there is an administrative lag in deciding which policies to follow; there is an operational lag in terms of the impact of the policy once it is implemented.
Second, there are political considerations in the adoption of fiscal policy. There is some evidence of a political business cycle where particular expansionary policies are followed in election years whether or not economic conditions merit them.
Third, there is an expectations complication. If businesses and households expect that the fiscal policy will be reversed in the future, they may not change their behavior in the way that would be expected if the fiscal policy was permanent.
Fourth, the taxing and spending decisions of state and local governments may counteract or reduce the effectiveness of fiscal policy decisions at the federal level. The U.S. government may enact an expansionary fiscal policy by increasing its budget deficit, but state and local governments often have to balance a budget and economic conditions may force them to adopt a contractionary policy that partially offset what the federal government is seeking to achieve.
Fifth, there is concern about possible offsetting effects of government borrowing crowding out private spending that would occur in the absence of the government deficit. [text: MA pp. 216-218]
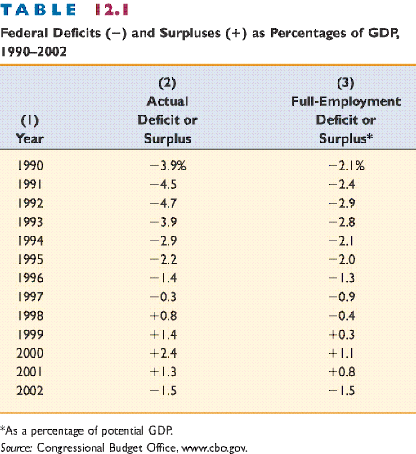
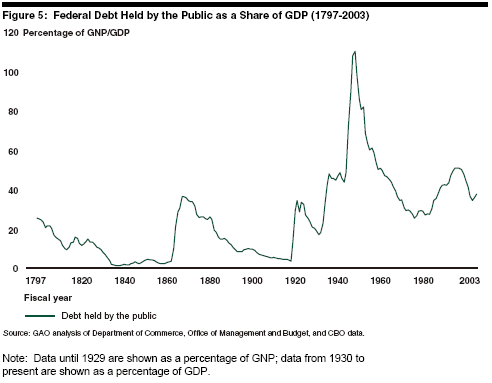
The national or public debt is the total accumulation of the Federal government's total deficits and surpluses that have occurred through time.The federal government's budget DEFICITS and SURPLUSES are ANNUAL differences between the revenue collected and government spending.Deficits (and by extension the debt) are the result of war financing, recessions, and lack of political will to reduce or avoid them.
The public debt was $7.96 trillion in 2005.
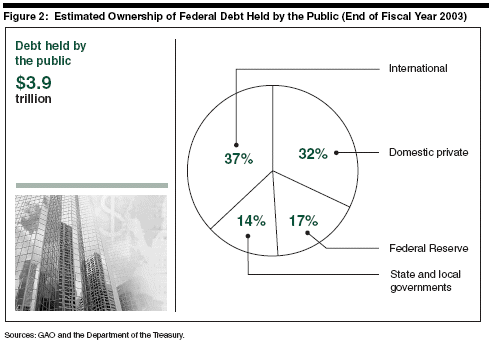
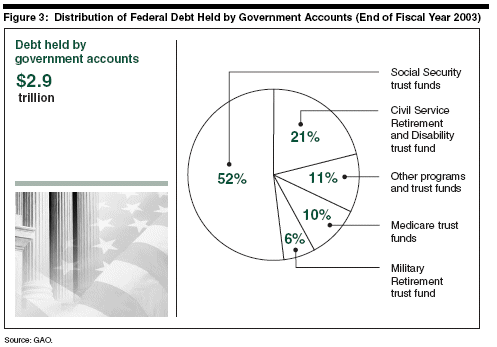
Ownership of the public debt (Figure 11.6)
Is there more than one type of federal debt? There are two types:$3.9 trillion (49 percent) held by the public and $4.06 trillion (51 percent) by Federal government agencies, including the Federal Reserve.
Debt Held by the Public – all federal debt held by individuals, corporations, state or local governments, foreign governments and other entities outside of the United States government. Types of securities held by the public include, but are not limited to, Treasury Bills, Treasury Notes, Treasury Bonds, and United States Savings Bonds. Currently, the debt held by the public stands at $4 trillion.
Intragovernmental Holdings – government securities held by government trust funds, such as the Social Security trust fund and the Medicare trust fund. Currently, intragovernmental holdings stand at $3 trillion.
The Federal debt held by the public was 31.4 percent of GDP in 2005, higher than in 2001 (27.7%) but less than in the 1990s. (Figure 11.7)
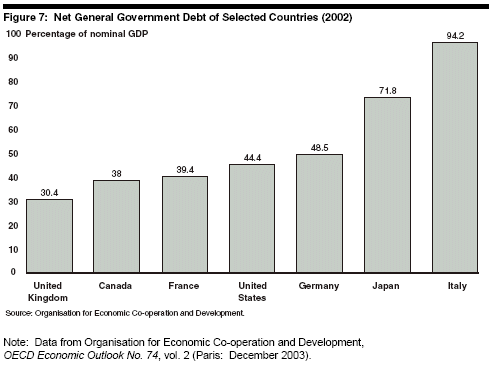
Public debt as a percentage of GDP in 2005 for a number of countries can be seen in Global Perspective 11.2. Although the U.S. has the highest public debt in absolute terms, a number of countries owe more relative to their ability to support it (through income, or GDP).
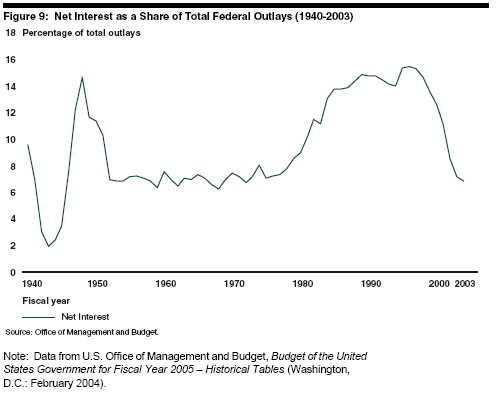
Interest charges are the main burden imposed by the debt.
1. Interest on the debt was $184 billion in 2005, and is the fourth largest item in the Federal budget.2. Interest payments were 1.5 percent of GDP in 2005. The percentage is important because it represents the average tax rate necessary just to cover annual interest on the debt. Low interest rates brought the percentage down from the 1990s.
False concerns about the federal debt include several popular misconceptions:
Can the federal government go bankrupt? There are reasons why it cannot.1. The government does not need to raise taxes to pay back the debt, and it can borrow more (i.e. sell new bonds) to refinance bonds when they mature. Corporations use similar methods-they almost always have outstanding debt.2. The government has the power to tax, which businesses and individuals do not have when they are in debt.
Does the debt impose a burden on future generations? In 2005 the per capita federal debt in U.S. was $26,834. But the public debt is a public credit-your grandmother may own the bonds on which taxpayers are paying interest. Some day you may inherit those bonds that are assets to those who have them. The true burden is borne by those who pay taxes or loan government money today to finance government spending. If the spending is for productive purposes, it will enhance future earning power and the size of the debt relative to future GDP and population could actually decline. Borrowing allows growth to occur when it is invested in productive capital.
Substantive Issues
Repayment of the debt affects income distribution. If working taxpayers will be paying interest to the mainly wealthier groups who hold the bonds, this probably increases income inequality.Since interest must be paid out of government revenues, a large debt and high interest can increase tax burden and may decrease incentives to work, save, and invest for taxpayers.
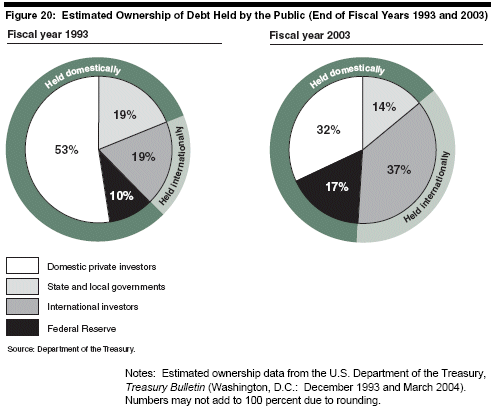
A higher proportion of the debt is owed to foreigners (about 18 percent) than in the past, and this can increase the burden since payments leave the country. But Americans also own foreign bonds and this offsets the concern.
Foreigners held about 25 percent of the public debt in 2005.
Some economists believe that public borrowing crowds out private investment, but the extent of this effect is not clear (see Figure 11.8).
There are some positive aspects of borrowing even with crowding out.1. If borrowing is for public investment that causes the economy to grow more in the future, the burden on future generations will be less than if the government had not borrowed for this purpose.2. Public investment makes private investment more attractive. For example, new federal buildings generate private business; good highways help private shipping, etc.