( NOTE: Soon after I moved to Illinois I bought a house in Wonder Lake in McHenry County. Wonder Lake is a nice lake, but we didn't own a boat.)
Confused? After you study the "5Es of Economics (below) it will begin to become more clear.
Before we begin post your answer to the following question on the Weekly Activities Survey for Week 1/Chapter 1. There is no need to study. What I want is your initial thoughts.
QUESTION:
Assume that a hurricane has struck the coast of Florida causing massive destruction. As a result, the prices of many products like hotel rooms, water, plywood, etc. increase significantly. For example, let's say the price of plywood increases from a price of $10 a sheet before the hurricane to $30 a sheet after the hurricane.What should the government do?
A. Pass a law to make these "price-gouging" increases illegal returning the price to $ 10B. Nothing. Let the price of plywood rise to $30 or more
C. Other. Please explain on the Discussion Board
Why "Macroeconomics in the Global Economy"?
At Harper we have no prerequisite for ECO 212 Macroeconomics, therefore, even though most students have already taken ECO 211 Microeconomics, many have not. Since some students have not had an economics course before we must cover the introductory chapters that most have already studied in their Microeconomics course. To make these introductory chapters interesting and new to those who have already studied them, we will discuss them in the context of the global economy. This allows us to review the basic economic concepts in a slightly different light and hopefully gain from the experience.
Also, global economics is "in the news". Words like "globalization", "free trade", and can be heard often in the daily news. In our first unit we will learn why.
BUT, much of what we hear in the popular press is contrary to what we are going to learn in this course. That makes my job, and yours, more difficult. For example, in the news article: Dobbs: New Congress must show courage [http://www.cnn.com/2006/US/11/28/Dobbs.Nov29/index.html] Lou Dobbs, CNN News commentator, says:
"We've lost three million manufacturing jobs as a result of these so-called free trade agreements that enable corporate America to export plants, production and jobs to cheap foreign labor markets."
Then read the following quote taken from our textbook (p. 405):
"The long-run impact of tariffs (restricting trade) is not an increase in employment . . . "
We will examine such opposite views later in this unit. Now we need to begin with some fundamentals.
Countries all around the world, including the United States are engaged in a process of globalization (or structural adjustment). It is occurring now and it will continue to occur. WHY? We will study globalization in more detail in the next chapter and throughout this first unit. To understand WHY it is occurring we need to first understand WHAT IS ECONOMICS including issues like: "Why it is GOOD for the people of Florida if, after a hurricane strikes, the price of plywood (or other products) increases from $10 a sheet to $30 a sheet".
The following discussion on the 5Es of Economics was borrowed (and modified) from: Economics: The Options for Dealing with Scarcity by Frank D. Tinari, Scott, Foresman and Company, 1986. IT IS NOT FOUND IN YOUR TEXTBOOK.
Just what is the study of economics? The definition that I like best is:
Economics is the study of how we choose to use limited resources to obtain the maximum satisfaction of unlimited human wants
This definition has four parts that we need to discuss:
The definition of "economics" that I used when I first began teaching was:
( NOTE: Soon after I moved to Illinois I bought a house in Wonder Lake in McHenry County. Wonder Lake is a nice lake, but we didn't own a boat.)
This definition highlights an important component of economics: SCARCITY. The reason why I didn't have a boat, or the reason why you don't have everything that you want, is because of SCARCITY.
The term "scarcity" has a slightly different definition in an economics class than it does in the "real" world.
If the price of boats goes up, then demand for boats goes . . . . . .
NO! THE DEMAND DOES NOT GO DOWN. The quantity demanded goes down, but not demand itself BECAUSE ECONOMISTS HAVE A DIFFERENT DEFINITION FOR DEMAND. We'll talk more about that later.
Another example is the word INVESTMENT. In an economics class the term "investment" does NOT mean the stock market, money markets. or mutual funds. We will have to call such things "financial investments" because the term "investment" has a different meaning in economics.
Is is important to be aware that economic terms may have a different, and more specific, definition in a college course than they do outside of class. You, of course, need to learn this new definition.
So back to the term SCARCITY. Scarcity does not mean that only a little of something is available. For example, I grew up in northeastern Minnesota . About 30 miles away from my hometown was the town of Erskine, Minnesota. Just outside of town a certain type of rock exists that occurs nowhere else in the world. They have named it "Erskinite". Erskinite is only found near Erskine, Minnesota and only a little of it has ever been found. BUT IT IS NOT SCARCE. -- WHY? - -
Erskinite is not scarce because nobody wants it. For there to be scarcity things must be LIMITED and WANTED. There is plenty of ERSKINITE and it IS NOT SCARCE because nobody wants it.

Goods and services are scarce. These are the things that we want. Goods are tangible things that satisfy our wants (like boats, computers, cars, etc.), services are intangible things that satisfy our wants (like the services of an accountant, or a dentist, or a lawyer). Even in the United States - one of the richest countries in the world - goods and services are scarce. WHY?
This brings us to another important principle in economics.
After teaching economics for a year or so, I bought a boat. Since I defined economics as the study of why I didn't have a boat - I had a problem. But then I simply changed my definition slightly. Now economics is: the study of why Mark doesn't have a . . a . . .a what?
This brings us to that second principle: economists assume that humans have UNLIMITED WANTS. Once I got a boat, I wanted a bigger boat. After getting a bigger boat I wanted a sailboat. then a row boat, and . . . and the list goes on and on. (I now own 5 boats and I want a jetski.) Do we ever have EVERYTHING that we could ever want?
Since human wants are unlimited, and resources used to satisfy those wants are limited - there is scarcity. Even in the US, one of the richest countries in the world, there is scarcity -- if we use our new definition of SCARCITY. Do you have everything that you want? There is always scarcity, because human wants are unlimited.
This then brings use to a third important idea: Because of scarcity we MUST MAKE CHOICES. Some economists call this the "economizing problem". We can't have everything that we want so we have to choose.

The authors of our textbook define economics as: "The social science concerned with how individuals, institutions, and society make optimal (best) decisions under conditions of scarcity" (p. 4).
This is what economics is really all about - MAKING CHOICES. Because of scarcity we as individuals, and our society as a whole, must make choices. For example when I was thinking about buying a boat, I also needed shoes for my daughter. If we assume that I couldn't afford both (again - can you afford everything that you want?) I had a choice to make a boat or shoes?
Hm-m-m-m-m? ? ? - - - - - I have a nice boat!
It is important to note that our GOAL is to make choices that reduce scarcity as much as we can. Because of unlimited wants we can never eliminate scarcity, but it can be reduced by the right choices.
Another way to say this is that we want SOCIETY to get the MAXIMUM SATISFACTION POSSIBLE out of our limited resources. We don't want to make just any choice, we want to make the BEST (or optimal) choice.
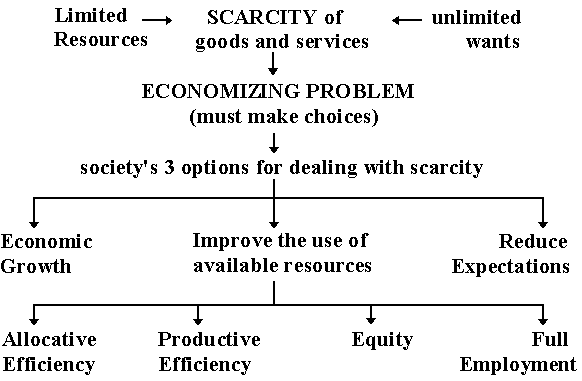
There are three, and only three, options (choices) for society to deal with scarcity, and all societies must deal with scarcity because there are limited resources and unlimited wants.
Those three options are:
There are four ways to use our existing resources wisely. They are:
The 5Es of Economics, or the five ways for society to reduce scarcity, then are:
A 6th "E" of economics might be Reducing Expectations, but economists do not spend much time discussing this option for dealing with scarcity.
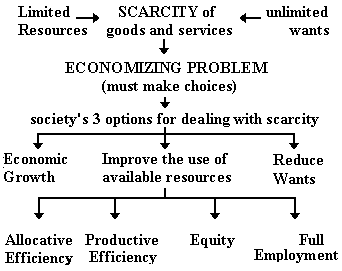
The figure below summarizes the concept of scarcity, the necessity of making choices, the three options that society has for dealing with scarcity, and the 5Es of Economics.
Let's now look at each of the five ways that society has for dealing with scarcity - the 5 Es.
Economic Growth
(The first option for dealing with scarcity and the the first "E" of
economics)
Let's define Economic Growth as an increase in the ABILITY to produce goods and services. Note that this is not the way the term is normally defined. The news media would define it as occurring when an country produces more in one year than they did in the previous year. Later this semester we'll discuss the various definitions of Economic Growth, but here we'll use this more fundamental definition:
Economic Growth is an increase in the ABILITY to produce goods and services. [MEMORIZE THIS!]
This type of Economic Growth is caused by a society getting:
a) more resources,
b) better resources, or
c) better technology.
How does economic growth reduce scarcity? If we only had more resources we could produce more goods and services and satisfy more of our wants. This will reduce scarcity and give us more satisfaction (more good and services). All societies therefore try to achieve economic growth.
(Note: This means we are ABLE to produce more, but it doesn't necessarily mean we do produce more. More on this later.)
Reducing Wants
(the second option that society has for dealing with
scarcity)
A second way for a society to handle scarcity is to reduce its wants. If we just didn't want so much then there would be less scarcity. For example we know that gasoline is scarce. (Can you get all that you want for the price you want? If you have to pay a price for something, then it is scarce.) Space on our roads is also often very scarce. Let's say that the president of the United States decides to do something about these problems by initiating a new program called: SHARE A CAR WITH YOUR NEIGHBOR. It includes a law that says there can only be ONE CAR FOR EVERY TWO FAMILIES. This would reduce the scarcity of gasoline and space on our roadways, but . . . . let's impeach that president!!!
The option of REDUCING WANTS is one of the options that societies have for dealing with scarcity, but it is not a very good option. Maybe during war time, if our president asks us to "share a car with our neighbor", we would. But it is not a long-term solution to the problem of scarcity that most of us would accept. Although it is an option that we should keep in mind. some groups do handle scarcity this way. Catholic nuns, the Amish, the hippies of the 1960s all reduce their wants of goods and services.
That brings us to the third option for dealing with scarcity (and to the remaining 4 "E's" of economics.)
Using our existing resources wisely = maximizing satisfaction
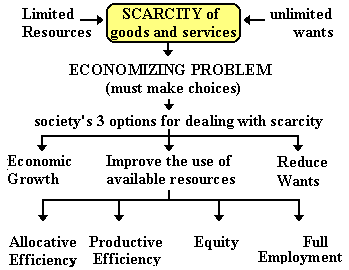
Societies can reduce scarcity not just by (1) getting more resources, better resources, or better technology (i.e. ECONOMIC GROWTH), or by (2) REDUCING ITS WANTS, but also by (3) USING THEIR EXISTING RESOURCES WISELY
There are four ways that societies can use their EXISTING resources to reduce scarcity. We could call these the 4 Es of economics - four ways to use our EXISTING resources to reduce scarcity and obtain the maximum satisfaction possible. The fifth E (economic growth) also reduces scarcity and gives us more satisfaction but it does it by using ADDITIONAL resources. Societies will try to achieve all 5 Es of economics.
The four ways that societies can use their EXISTING resources to reduce scarcity are:
Maximizing Satisfaction --
[Four More Es: Efficiency, Efficiency, Equity,
Employment]
Let's discuss each of these individually keeping in mind
This is harder than you think. many students have a hard time learning a different definition for a term that they thought they already knew, and many students lose sight of the GOAL of economics: to reduce scarcity and help society achieve the maximum satisfaction possible.
Productive efficiency can be defined as, or achieved by, producing at a minimum cost.
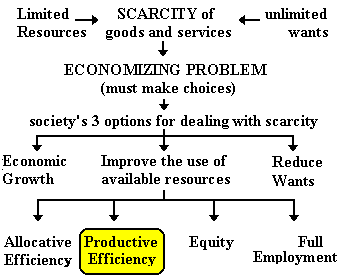
By producing at a minimum cost, FEWER RESOURCES are used and MORE can be produced. This reduces scarcity and gives us more satisfaction from our existing resources. [MEMORIZE THIS!]
We can produce at a minimum cost and achieve productive efficiency by:
a. not using more resources than necessary
b. using resources where they are best suited
c. using appropriate technology
Let's look at each of these individually using some examples. REMEMBER our goal is to understand how they reduce scarcity and help society achieve the maximum satisfaction possible from its existing resources. This is the goal of economics. You must keep this goal in mind as we go through these examples.
not using more resources than necessary
How does this MAXIMIZE SOCIETY'S SATISFACTION?If businesses use extra resources that they do not need, then these resources are wasted. Since we know that resources are limited and human wants are unlimited, let's not waste any of the few resources that we do have. By not using more resources than necessary, we free up resources that can be used somewhere else and we PRODUCE MORE.
Examples:
(a) Janitors at HarperLet's assume that Harper College employs 50 janitors to clean its buildings and that's enough to do a good job. If Harper then hired 25 more janitors this would be wasteful. Even though they could probably find something to do to keep busy, they aren't needed. Fifty janitors can do the job. So society would be better off if Harper did NOT employ these additional janitors so that they could go get a job somewhere else (like maybe at a boat factory) where they would produce more for society. It would be productively inefficient to employ 75 janitors at Harper. Harper's costs will be higher (productive inefficiency) and society's output would be lower (less boats = less satisfaction).
(b) Grocery stores: USSR
Several years ago, one of my students gave me this example. She had visited Moscow when the communist Soviet Union still existed. She said that she was surprised when she entered a grocery store and saw four employees at every cash register! What a waste of labor resources. In the US we find one, or two, workers at a checkout stand and only a few will be open. In Moscow ALL stands were open with four employees each. This is productively inefficient. Their costs are higher and since labor is being wasted, they will produce less. Some of these workers could be working elsewhere producing more. They are not achieving the maximum satisfaction possible from their limited resources (productive inefficiency).
(c) Coca-Cola/Motorola/Sears/AT&T/etc. lay off 1,000s of workers
Take a brief look at one or a few of the following news articles. (When you click on the link they should appear in a new browser window.)
- Coca-Cola Lays off 6000
http://cnnfn.com/2000/01/26/worldbiz/coke/In the year 2000 , Coca-Cola laid off over a fifth of its workforce. do you remember a shortage of Coke products that year? If we can assume that Coke laid off these workers and was still able to produce the same quantity of Coke then they were employing more resources than necessary and were not producing at a minimum costs. They were productively inefficient.
Often, but not always, when you hear about massive layoffs in the news media, this is GOOD NEWS. It means that companies have found ways to produce products using fewer resources (lower costs) and this "frees up" labor that is then available to work else producing MORE for society.
Other articles:
Why are these layoffs good for society?
If each company was able to continue producing the same amount of output after laying off thousands of workers then they must have been productively inefficient before the layoffs. So, if it would be good for Harper to only employ 50 janitors (and layoff the extra 25) or if it would be good for the grocery stores in the Soviet Union to lay off some of their employees, THEN THESE LAYOFFS ARE GOOD FOR SOCIETY.
I realize that this may be a bit controversial. If you have questions let's discuss them on our discussion forum. (When you click on the link it should appear in a new browser window.)
Keep in mind the GOAL: reducing scarcity and achieving the maximum satisfaction possible from our limited resources. If these companies can still produce the same amount of output with thousands fewer employees, by laying them off they become available to work somewhere else producing MORE for society.
WHAT IF THEY DON'T FIND ANOTHER JOB? Would it be better for society to have them stay at companies where they are not needed or to be unemployed?
I would consider the possibility that it would it be BETTER for society to have them be unemployed. That way we know they are AVAILABLE for any new boat companies that may want to build a new factory. Let's assume that the Coca-Cola company has 6000 workers in Atlanta that they do not need (productive inefficiency) This means if they laid off these 6000 workers they could still produce the same quantity of Coke. It would be a shame if a boat company wanted to build a brand new factory near Atlanta, Georgia, but then after investigating the labor market there they decide not to build the factory because there were not enough workers available because they were all working at Coca-Cola
Note: not all layoffs are good for society.
WHY ARE THERE LAYOFFS?
- If there is productive inefficiency
- Improved Productive efficiency allows business to produce the SAME AMOUNT OF OUTPUT with fewer workers
- These layoffs are GOOD for society because they reduce scarcity (more products are produced)
- If there is allocative inefficiency
- Allocative efficiency means the economy uses its limited resources to produce what people want
- Resources are not wasted producing products that people do not want
- Some layoffs occur in industries that were producing products that people no longer wanted
- These layoffs are GOOD for society because they reduce scarcity (more products are produced)
- If there is a recession
- Some layoffs are the result of an economic recession when unemployment rises and people buy fewer products
- These layoffs are NOT GOOD for society because they result in MORE SCARCITY (fewer products are produced)
using resources where they are best suited
The second way to produce at a minimum cost and achieve productive efficiency is to use resources where they are best suited.How does this MAXIMIZE SOCIETY'S SATISFACTION?
If businesses use resources where they are best suited then MORE can be produced from the same amount of resources.
Examples:
(a) secretaries / truck driversLet's say I own a company which employs secretaries and truck drivers. Normally the secretaries type letters and the truck drivers drive trucks. One day I decide to try something new . I had the secretaries drive the trucks and the truck drivers type letters.
What happened to the COST per load delivered or the COST per letter typed? Hopefully you were thinking "they went up." Therefore we are not producing at a minimum cost and we are productively inefficient. Furthermore, and most importantly, LESS WILL BE PRODUCED.
Therefore, to be productively efficient and achieve the maximum satisfaction possible from our existing resources we must use resources where they are best suited.
(b) doctors/engineers
Doctors should work in the hospitals and engineers should build the bridges. This would be productively efficient. More bridges will be built and more lives saved . It would be productively inefficient (i.e. more costly) to have engineers work in the hospitals and doctors build the bridges. Fewer bridges would be built and fewer lives saved. This would be productively inefficient - a waste of existing resources.
(c) Illinois-corn/Alabama-cotton - another example, but with something new
Illinois has resources (weather, machinery, soil, etc.) better suited to grow corn, whereas Alabama has resources better suited to grow cotton. So it makes sense for Illinois to grow corn and for Alabama to grow cotton since this way we get more corn and more cotton from the same amount of resources. This is productively efficient. But there is just one problem. In Illinois we have a lot to eat (corn) but no clothes (cotton). And in Alabama they have cotton clothing, but they are staving. So what do we do?
We exchange or trade. We in Illinois sell corn to those in Alabama and they sell cotton to us.
If we didn't trade then we would have to grow both corn and cotton and Alabama would have do the same. The result would be LESS CORN and LESS COTTON being produced. from the same resources we would have fewer goods because we are not using resources where they are best suited - i.e. productive inefficiency.
(d) North Dakota-potatoes / Honduras-sugar
North Dakota has resources suited to growing potatoes (cold climate, good soil, etc.). Honduras, in Central America, has resources suited to growing sugar, or sugar cane (hot wet climate, poorer soils, etc.). So it is productively efficient to grow potatoes in North Dakota and to grow sugar in Honduras. Costs are lower, and more importantly, more can be grown with the existing resources. this helps society get the maximum satisfaction possible from its existing resources.
Why, then, do they grow sugar (sugar beets) in North Dakota? The sugar that we get from sugar beets is very expensive. Why do we grow sugar beets in North Dakota when we can get cheap, high quality, sugar from Honduras?
The answer has to do with trade. There is free trade between Illinois and Alabama. Free trade means that the government does not try to restrict trade with taxes or other barriers. Therefore, Alabama and Illinois can use their resources where they are best suited and achieve productive efficiency, i.e. they produce more with the resources available.
But there are trade restrictions on sugar between the US and Honduras. This, then, encourages the farmers to be productively inefficient. The barriers to free trade results in higher prices and this encourages North Dakota farmers to grow sugar resulting in productive inefficiency and LESS BEING PRODUCED.
(e) free trade
Free trade, then, is a necessary condition to achieve productive efficiency since it allows resources to be used where they are best suited - regardless of the state, or the country. [REMEMBER THIS: free trade helps achieve productive efficiency by allowing companies/countries to use resources where they are best suited.]
(f) discrimination
Economists have a slightly different view of discrimination than you are probably used to. Economists would ask, "How does discrimination affect the quantity of boats (and everything else) that are produced with the resources available?" Since discrimination is by definition NOT USING RESOURCES WHERE THEY ARE BEST SUITED, it results in higher costs and less output - or productive inefficiency.
using appropriate technology
The third way to produce at a minimum cost and achieve productive efficiency is to use the appropriate technology. By "appropriate" we mean the technology that minimizes the costs. Sometimes this is termed the "best "technology. But I prefer "appropriate" because "best" may infer "high tech" or computer technology. But the most up-to-date technology is not always the most appropriate (lowest cost).How does this MAXIMIZE SOCIETY'S SATISFACTION?
By using the technology that minimizes costs, it minimizes the amount of resources used, since it is the resources that make up the costs of production.
Examples:
(a) farming: US / KenyaFor example, in the US farmers use tractors to plow their fields, whereas in the country of Kenya (in East Africa) most field are plowed by hand. It could be argued that both farmers ARE being productively efficient. The cheapest way to plow in the US is my using a $100,000 tractor. In Kenya, tractors, fuel, repairs, etc., are very expensive and labor is relatively inexpensive, so it makes economic sense to plow by hand.
(b) farming: tractors / helicopter
Why don't US farmers use "modern" technology and plow their fields with helicopters and laser beams (sort of like the Jetsons)? The answer is easy, it would be too costly. There are cheaper, and more productively efficient, ways to get the job done.
The second way to use our existing resources to maximize society's satisfaction is allocative efficiency.
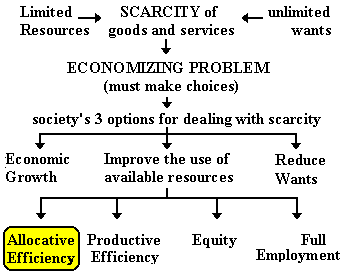
Allocative efficiency is using our limited resources to produce the right mix, or amounts, of the various goods and services - not too much, not too little, but the amount that gives society the most satisfaction. this means it is allocatively efficient to produce more of what people want and less of what they don't want.
How does this MAXIMIZE SOCIETY'S SATISFACTION and REDUCE SCARCITY?
The answer to this question is obvious. If we want to achieve the maximum satisfaction possible from our limited resources, we not only have to be productively efficient (use as few resources as possible, use our resources where they are best suited, and use the appropriate technology), BUT WE ALSO HAVE TO PRODUCE THE RIGHT GOODS AND SERVICES. It would be a waste of our limited resources to produce a lot of things that we don't want and few of the things that we do want.
For example:
a. steel: horseshoes or carsIt would be a waste of our limited supply of steel to produce billions of horseshoes that nobody wants and only a few cars that people do want. This would be allocatively inefficient.
b. crude oil: gasoline or kerosene
People want more gasoline and very little kerosene. Therefore to use our resources wisely, we should use our crude oil to produce more gasoline and less kerosene.
How does allocative inefficiency affect scarcity and our attempt to maximize society's satisfaction?
c. small cars or SUVs?As consumer tastes in the 1980s moved away from small cars to large Sport Utility Vehicles, an allocatively efficient society would use its resources to produce more SUVs and fewer small cars. Now, people want smaller, fuel efficient cars, so it is good for society if car companies lay off workers in their gas-guzzling SUV factories and hire more in their small car factory. This helps society achieve allocative efficiency and increase the satisfaction that society gets from its (labor) resources.
Allocative INefficiency occurs when we use our limited resources to produce TOO MUCH or TOO LITTLE. This wastes resources and results in surpluses and shortages.
Whenever we produce too much (surplus) or too little (shortage) we are allocatively inefficient. We are NOT using our resources in a way that would achieve the maximum satisfaction possible.
Examples of allocative inefficiency:
(1) US agriculture producing mountains of unwanted grainUS (and European) farmers used to produce mountains of grain that they couldn't sell. WHY? Pizza Hut doesn't produce piles of pizza that they cannot sell. Homebuilders do not build hundreds of homes that they cannot sell. Why did US farmers grow more grain than they knew they could sell?The answer is - the government. The US government would buy the surplus grain from the farmers. This encouraged them to plant even more. The allocative inefficiency here is not the mountains of grain that nobody wants, but rather the loss of the resources farmers used to grow that grain. Labor, land, energy, chemicals, machinery, etc. was wasted producing something that society didn't want. The real loss for society are the products that we COULD HAVE HAD if farmers hadn't used so many resources producing excess grain. This is allocative inefficiency and it reduces the satisfaction that society receives from its resources. (NOTE: recent changes in government policy have reduced the amount of excess grain being produced.)
Long lines in Poland and other communist countries
Prior to 1989 when communism in Eastern Europe collapsed, Poland and other countries had severe shortages of consumer products resulting in long lines (queues). This is a good example of allocative inefficiency. Severe shortages reduces society's satisfaction.(3) Super Bowl tickets
There is a shortage of Super Bowl tickets. Hundreds of thousands of fans want to attend the game but only about 80,000 seats are available. This is allocative inefficiency. WHAT CAN BE DONE?Build a bigger stadium? Play a 2 out of 3 (or 4 out of 7) series? OR - why not simply raise the price? The price of a regular Super Bowl ticket is around $300. At this low price, hundreds of thousands of people want to go. But what if the price was raised to $1000 or $2000, or to whatever price will result in only 80,000 tickets being sold. If they raise the price, there will be no shortage. SHORTAGES ARE CAUSED BY A PRICE THAT IS TOO LOW. This results in allocative inefficiency and less satisfaction for society.
Prices are very important. Allocative inefficiency is usually caused by the price being too high (creating a surplus) or too low (creating a shortage).
(4) Natural disasters: "price-gouging"
Let's try another example to illustrate the importance of getting the price right to achieve allocative efficiency. After hurricane Georges struck Florida in 1998 the price of plywood, water, hotel rooms, and many other things increased dramatically. Were these price increases BAD for the people living in Florida?
NO!!!!
This may seem controversial to many of you, but let me explain and I think you will agree with me. Why it is GOOD for the people of Florida if, after a hurricane strikes, the price of plywood (or other products) increases from $10 a sheet to $30 a sheet
[See: http://netra.sptimes.com/Weather/92698/Gouging_complaints__r.html]After Hurricane Georges, the people of Florida did not have all the plywood that they wanted, or needed. This is allocative inefficiency (shortage). To help them we would want two things to occur:
(1) more plywood should be shipped to Florida, and2) the people of Florida should try to conserve the plywood that they do have.
These two things would be good for the people in Florida.
Let's say that the price of plywood increased from $10 a sheet to $30 a sheet. WHAT HAPPENS BECAUSE OF THIS PRICE INCREASE?
Well, people standing in line to buy plywood to fix their walls, their decks, and their doghouses, will buy less and maybe decide to only fix their walls now, i.e. they conserve. This is good for the people of Florida.
ALSO, maybe somebody sitting in the back of their pickup truck on a Friday night in Chicago will hear a news report on the high price of plywood in Florida. And they may start to calculate: 100 sheets that would fit in the back of the pickup would cost, in Chicago, $1000 (100 sheets times $10 a sheet). If they drove to Florida they could sell the sheets for $3000 (100 sheets times $30 a sheet). This is a profit of $2000 in one weekend! Trucks full of plywood would be heading for Florida from all parts of the country! This is good for the people in Florida.
Now, let's say that the government of Florida wants to "help" its citizens by preventing this "price-gouging" or these higher prices that occur after a natural disaster. So they pass a law making price-gouging illegal. Let's assume that if you sell plywood for more than $10 a sheet you will be arrested. (See links below.) WHAT IS GOING TO HAPPEN? Does this Law help the people in Florida who need plywood?
First, if the people in all those pickup trucks full of plywood hear of this anti-price-gouging law, they will turn right around and drive home. This is bad for the people of Florida.
Also, those people standing at the front of the lines at the lumber yards, seeing that the price is still only $10 a sheet, will buy extra to repair their decks and fix their doghouses. This is bad for the people of Florida.
The result of the anti-price-gouging law is a SHORTAGE. A shortage CREATED by the law, not by the hurricane.
When the price of plywood rises to $30 a sheet after a hurricane it is allocatively efficient and GOOD for the people of Florida. They will CONSERVE the plywood that they have and MORE will be shipped in. This is good. Do you agree?
Oftentimes students say, "what about the poor people who can't afford the higher prices?" Will the anti-price-gouging laws help them?
NO, because there will be a shortage. This means NO PLYWOOD is available for anyone (unless they just happen to be at the front of the line).
There are better ways to help the poor. This is especially true if we can agree that the laws keeping the prices down actually hurt the poor by creating a shortage. The government could give the poor money, or haul in more plywood - but a law that keeps prices low hurts all.
I realize that this may be a bit controversial. If you have questions let's discuss them on our discussion forum. (When you click on the link it should appear in a new browser window.)
Articles on "price-gouging" in Florida:
- http://netra.sptimes.com/Weather/92698/Gouging_complaints__r.html
- http://www.sptimes.com/Weather/92598/Pinellas_put_on_price.html
(5) food price controls
The government-created low prices in Florida after a hurricane CREATED A SHORTAGE. What if a government keeps food prices too low? What do you call a shortage of food? -- FAMINE or STARVATION! Millions of people have been starved to death by governments that have lowered food prices creating famines. The purpose of keeping food prices low was to help the poor and the hungry. The effects of keeping food prices low is famine. Two things happen when governments lower food prices: (1) farmers make less money so they work less and grow less, and (2) since prices are low those who do find food buy more. The result is a shortage.
(6) gasoline
Different government policies concerning gasoline prices have had different effects.(a) W.W.II
During World War II, the US government kept the price of gasoline down. This created a shortage. To handle the shortage they had to issue ration coupons. If you wanted to buy gas, you first needed a coupon. The government created the shortage. The government created allocative inefficiency.
(b) 1970s: Arab oil embargo
In the 1970s, Israel attacked its Arab neighbors and the US supported Israel. In response, the Arab oil producers refused to sell oil to the US. This would have caused the price of gasoline to increase greatly, but President Nixon prevented the price from rising. This created a shortage. Gas stations had long lines (queues). Some would only sell gasoline on certain days or limit a purchase to 5 gallons. The government created the shortage. The government created allocative inefficiency.
(c) during the Gulf Wars / Iraq war
In the early 1990's the government of Iraq invaded the country of Kuwait disrupting oil exports from the Persian Gulf. But there was NO shortage of gasoline! If you wanted to buy gas you just had to drive to a gas station and fill 'er up. Why wasn't there a shortage of gasoline this time? Because the government allowed the market to work and the price increased. As a result two things happened: (1) gasoline producers did all they could to produce more gasoline because they were making a lot of money, and (2) drivers conserved, carpooled, bought smaller cars, and drove less. Hence, NO SHORTAGE. This was allocatively efficient and good for society.
WHAT CAN BE DONE to achieve allocative efficiency?
In a market economy, or pure capitalism (we will study this in chapter 2), the price will adjust to achieve allocative efficiency (we will study this in chapter 3). Very little "has to be done".
Inefficiency occurs when :
Prices are very important. Allocative inefficiency is usually caused by the price being too high (creating a surplus) or too low (creating a shortage). In chapter 3 we will study how a market economy results in prices that usually achieve allocative efficiency. In chapter 5 we will study how the government sometimes interferes with prices and causes allocative inefficiency. This means that the government causes more scarcity and reduces society's satisfaction. Also in chapter 5 we will study examples of when the market does NOT get the price right and then the government may interfere, changing product prices, in order to achieve allocative efficiency and increase society's satisfaction.
To achieve allocative efficiency in a market economy like that of the United States, the price has to be "right".
Why is the price of gasoline in the United States TOO LOW? Don't be surprised, many people believe gasoline prices are too low. In chapter 5 we will study why many countries in the world have large taxes on gasoline. For now you should be thinking that maybe the market for gasoline in the United States is allocatively inefficient because the price is too low; therefore we consume too much (allocative inefficiency); and possibly it would be good if we raised our gasoline taxes to be more like most other countries.
I realize that this may be a bit controversial. If you have questions let's discuss them on our discussion board. (When you click on the link it should appear in a new browser window.) All I want to say now is to ask "WHY are gasoline prices so much higher in Europe than in the US? (see http://www.eia.doe.gov/emeu/international/gas1.html. Think about it. They buy their gasoline from the same companies as we do. They are closer to the Middle East, the source of much of the oil used to produce gasoline. So you would think that their prices would be the same as ours. What causes the difference?
Students usually say things like:
But, if these are true then they are the RESULT of high gasoline prices, not the CAUSE of them. They have better public transportation, drive smaller cars, and drive less BECAUSE gasoline prices are high -- BUT WHY ARE THEY SO HIGH IN THE FIRST PLACE?
The correct answer is TAXES. In Europe they have a much higher tax on a gallon of gasoline - like up to $3.00 per gallon! Voters in these countries have elected and reelected officials who support high gasoline taxes. Basically, what the voters have said is "gasoline prices are too low and we want the government to raise them". So the question "Why is the price of gasoline in the United States TOO LOW ?" may not that crazy. We will discuss this more in chapter 5.
See: http://gregmankiw.blogspot.com/2006/10/gasoline-taxes-around-world.html
The third way to use our existing resources to achieve the maximum satisfaction possible is equity.
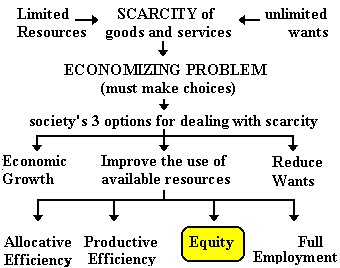
DEFINITION: Equity is a "fair" distribution of income, or goods and services. (NOTE: this is not the same definition used by accountants.) One problem with this definition is agreeing on what "fair" means.
Fair does not mean "equal". Would an equal distribution of income be good for society? Would it be good if doctors were paid the same as janitors? Probably not. If we paid doctors the same as janitors we would have few doctors, and they would not put in the time needed to learn medicine.
We know that equity is good for society (it is one of the five Es). So equitable cannot mean the same as equal. But we can't measure "fairness". This is a problem for economists. But we can DESCRIBE the actual distribution of income but we can't say if it is "fair". After describing the actual distribution of income I will also try to explain how equity does help society achieve the maximum satisfaction possible from its limited resources.
The Distribution of Income.
When economists describe the distribution of income they usually divide the population into groups of equal sizes (usually five called quintiles) according to their income levels. In the first quintile the put the poorest fifth (20%) of the population. In the fifth quintile they put the richest twenty percent. and they divide the remainder into the other three groups according to their incomes.
For data on the distribution of income in the US see: http://www.census.gov/hhes/www/income/histinc/f02AR.html
What quintile are you in? http://www.census.gov/hhes/www/income/histinc/f01AR.html
For 2007 the US distribution of income was:
|
|
|
|
|
|
|
|
|
|
|
|
|
|
Comments (discussion forum) ?
How does equity help society achieve the maximum possible satisfaction from its limited resources? This is a very difficult concept for many students to understand. Please read my "President Obama Example carefully.
President Obama Example
Since it is difficult for us to agree on a definition of "fairness", let me see if I can come up with an extreme example on which we can all agree. What if President Obama owned everything? I mean EVERYTHING - all the land, all the buildings, all the food, all the clothes all the cars, -- everything in the country. Therefore, the rest of us own nothing. We are homeless, starving, and naked. Not a pretty picture, but can we all agree that this is not fair (not equitable)?Now, let's say that President Obama gives us each a pair of pants. We should be able to agree that this is more fair, more equitable, right? So what happens to society's satisfaction? By "society" I mean all of us including President Obama. We who received the pants are more satisfied since each of us has a pair of pants, but President Obama is less satisfied because he has 300 million fewer pairs of pants.
So what happens to society's (us and Obama) TOTAL satisfaction? It depends on HOW MUCH happier we are and HOW MUCH less happy President Obama is. This brings us to the Law of Diminishing Marginal Utility (you may wan to look this up in the index of your textbook).
Utility is the reason we consume a goods or services. You might call it the satisfaction that we get when we consume something. I get satisfaction (utility) when I drive my boat. I get utility (satisfaction?) when I go to the dentist.
"Marginal" means EXTRA or ADDITIONAL. so if I drive my boat a second time I get some additional (marginal) utility.
According to the law of diminishing marginal utility the EXTRA (not the total) utility diminishes for each additional unit consumed. The first time I drive my boat in the spring I really enjoy it. But after a few weekends of boating it doesn't give me as much additional satisfaction as the first time. I still go boating. My total utility still goes up. But the MARGINAL (extra) utility I get from one more day goes down.
OPTIONAL: For more information or a different explanation see:
Back to the President Obama Example. Since we start with no pants, the first pair we get from President Obama gives us A LOT of utility (satisfaction). But, since President Obama still has millions (or billions) of pairs of pants left, giving us 300 million causes his utility (satisfaction) to go down only A LITTLE. OVERALL the society's utility (all of us including President Obama ) increases. From the same amount of resources we (include Obama) are receiving more satisfaction.
The last E is full Employment.
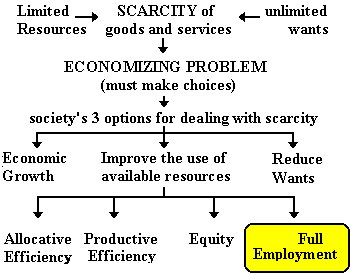
To me this is the easiest E to understand how it reduces scarcity, but students seem to have a problem with it. Keep it simple!
DEFINITION: Here we will define full employment as using ALL available resources, not just labor. This means that if we have full employment we are using all of our labor, factories, mines, fields, etc.
How does full employment help society achieve the maximum satisfaction from its limited resources or how does full employment affect the scarcity of goods and services?
If we have full employment, we produce MORE. If we have unemployed resources, we produce LESS. This is why society's strive for full employment - it reduces scarcity and helps achieve the maximum satisfaction possible because with full employment MORE is produced.
FROM THE AUTHORS:
The concept of "full employment" is potentially problematic, particularly for those courses that will eventually cover macroeconomics. The use of the term in this chapter refers to the use of all available resources, human and non-human. In macroeconomics the concept is used to describe general conditions in labor markets and the economy as a whole, but is usually focused on the economy's use of its human resources. Even then it is recognized that under conditions of full employment there is unemployed labor. There is also the potential for confusion as the concept applies to the land resource. Fully employed deposits of coal or petroleum do not imply exhaustion of those resources. It is more a question of whether there is an adequate amount of these non-human resources available to sustain full employment in labor markets. A full discussion of this is probably not appropriate with students at this point, but you may find it useful to emphasize here that the concept is most often applied to the human resources. Then, when the topic arises again in Chapter 9 (for those covering macroeconomics), students will be less likely to feel that you are changing definitions on them.
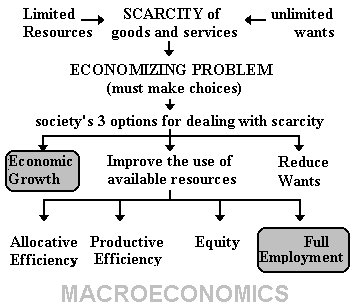
ECO 212 ONLINE! is a course in MACROECONOMICS. In a Macroeconomics course we will study the WHOLE ECONOMY or the ECONOMY OF A COUNTRY.
The Macroeconomic Issues are:
If we use our 5 Es framework, in a course in Macroeconomics you would study ECONOMIC GROWTH and FULL EMPLOYMENT.
In a course in MICROECONOMICS (ECO 211) you study the INDIVIDUAL parts of an economy. Issues would include the determination of prices of individual products, studying individual industries, or making individual consumer choices.
Using our 5Es framework, a course in Microeconomics would study ALLOCATIVE EFFICIENCY, PRODUCTIVE EFFICIENCY, and EQUITY. The
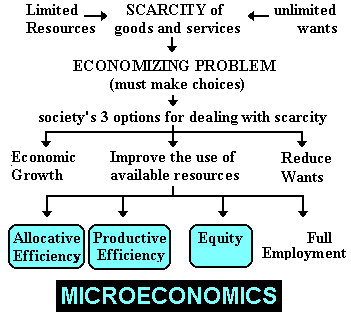
The only component of economics not included in either a Macroeconomics course or a Microeconomics course is "Reducing consumer wants.'
Why Study Economics/Macroeconomics?
Most of you are taking this class because it is REQUIRED for your major. Right? Most of you are probably business majors (management, finance, marketing, accounting, etc.), but other majors sometimes also require a course in economics (political science, engineering, dietetics, education, nursing,).
Another reason to take an economics course is to become a more informed voter and citizen. Much of what the candidates and political leaders discuss can be better understood with a knowledge of economics. This semester let's pay attention to the economic and political news. We can use the discussion forum to discuss what we see and hear.
"Study Of" -- Using theories
If we go back to our formal definition of economics:
we see that we have already discussed the necessity of choice, scarcity (limited resources and unlimited wants) and achieving the maximum satisfaction possible (4Es). We have not yet discussed the "study of" part of our definition. Maybe a better defoinition would be:
OR
Two related characteristics of economics social science courses make them difficult for some students:
Our study of economics will be quite theoretical an to make it a little more complicated, economists often use graphs to illustrate their theories. First let's talk about the theoretical nature of economics.
You have probably heard it said that something "sounds good in theory, but it doesn't work in the real world". Ross Perot, billionaire and Reform Party candidate for president in 1996, said this about the theory of comparative advantage, the theory behind international trade. Perot opposed NAFTA, the North American Free Trade agreement between the U.S., Canada, and Mexico. He said, "Free trade sounds good in theory, but it doesn't work in the real world."
But this doesn't make sense.
Good theories have to work in the real world or they are not good theories. Theories are only useful if they help us understand the "real world".
Five characteristics of economic theories are worth noting:
|
FROM THE TEXTBOOK:
|
Theories are based on facts (data). Economists gather data then try to find theories to explain the data. Let's take a simple theory:
This theory is based on the facts, but memorizing hundreds of different price and quantity combinations for various types of pizza would be difficult and quite useless.
Theories then simplify the facts. Hundreds of pages of facts would not be very useful to us. It is much simpler to learn that if the price of pizza rises, the quantity sold declines.
A former instructor at Harper College coined the term "Aunt Martha Syndrome" to illustrate that theories are generalizations of the facts. Every semester there seems to be a student who tries to prove that a theory is wrong by finding an exception. They'll say, "My Aunt Martha buys MORE pizzas if the prices rise." We have to understand that economic theories are not designed to explain every instance, but rather general patterns. An economist can't explain Aunt Martha's behavior. Maybe a psychologist can help.
Theories are also abstractions. Like modern, abstract, art, theories may bear little actual resemblance to the real world. Yet, like modern art, theories can still be useful.
For example, if I needed to draw a picture of a person for this economics class, I might draw something like:

Even though this doesn't look much like people really do - it is a quick, and useful, way to represent reality. BUT, if I was in an art class and drew this picture for my final class project I would fail. It is not a good and useful drawing for an art class. Theories, as abstractions, are similar. In order to make them simple, they are designed to be used only for specific purposes. One of your jobs as a student of economics is to learn what each theory is designed to explain and what they don't explain.
This picture of a stick man is based on facts (people have two arms, two legs, etc.), it is simplified, it is generalized (not all people have two arms or two legs) and it is abstract (useful for some purposes, useless for others).
Finally, since economics is a social science, economists study human behavior. This makes experimentation more difficult than in the other sciences. If you were to conduct a biology experiment to see how the amount of light affects plant growth you may select five plants of the SAME kind, put them in the SAME size pot, add the SAME amount of water and fertilizer to each, but then give each plant a different amount of light each day.
But if you wanted to test what happens to the quantity of pizza sold when the price of pizza rises
You could not control all other factors that may affect the experiment. Many other factors may also affect the quantity of pizza sold - higher incomes, different lifestyles, cheaper beer, etc. Therefore, economists as social scientists employ the ceteris paribus assumption. Ceteris paribus is Latin for "all other things remain equal". To control for other factors, economists ASSUME that they don't exist. This isolates the issues being studied (price and quantity), but it does make the theory less realistic.
Economists often use graphs to illustrate their theories. Pay close attention to the appendix to chapter 1 and to the study guide questions if you are uncomfortable using graphs. THIS IS IMPORTANT. IF YOU ARE NOT USED TO READING GRAPHS, SPEND TIME NOW LEARNING ABOUT GRAPHS SO THAT YOU CAN SPEND TIME LATER USING GRAPHS TO LEARN ABOUT ECONOMICS.
I don't have much to add to it except this: any point on a graph represents two numbers. You find one number by looking at the x-axis directly beneath the point. And you find the other number by looking at the y-axis directly to the left (usually left) of the point. don't let the graphs confuse you. They only represent different combinations of two numbers.
We've already discussed scarcity and the necessity of making choices in an earlier lecture. Here we begin looking at the consequences of making choices. We'll begin by looking at economic resources (since this is where it all begins, we probably should have began there). Then we'll introduce our first models (the budget line and the production possibilities graph) and use them to illustrate (1) the necessity of making choices and (2) some of the consequences
First we will take a quick look at what are resources. Remember, it is because of limited resources (and unlimited wants) that we have to make choices.
Then we'll look at individual economic choice and use a model (graph) called the budget line
Finally, we will look at society's economizing problem and use a model (graph) called the production possibilities curve.
LIMITED RESOURCES: THE FACTORS OF PRODUCTION
Economist uses several terms for resources including" resources, inputs, factors of production.
What is a resource?
How would you define the term "resource"? Our diagram of scarcity will give us a clue:

Resources are those things we use to produce the things we want, goods and services.
Types of Resources
Economists classify resources into four categories or types: (1) land, (2) labor, and (3) capital. (4) the entrepreneurial ability
1. Land
Land is one of those words in economics that has a different meaning than in the real world. Examples of "land" would include lakes, rivers, oceans, iron ore, crude oil, and the land beneath our feet. A definition would be "non-human natural resources. Why don't we just call them natural resources? That would be too easy.
2. Capital
Examples of "capital" include machinery, tools, highways, and factories. Note that capital in economics does not mean not "money". When you hear someone say, "we need to raise enough capital (money) to start a new business", they are using a different definition of the term "capital".Is money a resource? NO. If resources are those things that we use to produce the goods and services we want, then what do we make out of money? I guess you could use it to wallpaper a room, or if you bleach all the ink off of money you could make a notepad.
Capital, then, is a manufactured resource - something that you produce and use it to produce something else.
3. Labor - I think we all know what labor is.
4. Entrepreneurial Ability
The entrepreneur is a very important type of labor. Without the entrepreneur, we would not get any goods or services. The entrepreneur does four things:
- comes up with new ideas
- brings all the other resources together
- makes the basic decisions, and
- takes the risks to earn profits (or losses.
Without the entrepreneur all the other resources just lie around and do nothing. For example, Russia has much "land" (natural resources). They have a fairly well educated labor force. and a pretty good capital infrastructure ("good" compared to many countries, but rapidly deteriorating). What Russia is lacking are entrepreneurs. People with the ideas and abilities to put hose ideas into action. Soon after the collapse of communism, the US sent Peace Corps volunteer to Russia, volunteers with MBAs (Masters of Business Administration) and/or business experience.
Now take this short quiz: Resource Quiz
MAKING CHOICES: INDIVIDUAL'S ECONOMIZING PROBLEM
Before studying this part of the textbook you may want to study the appendix to chapter 1 on graphs. Remember this, any point on a graph simply represents TWO NUMBERS. If a graph confuses you just write down the two numbers. Two numbers should not be confusing to anyone.
Outline of the textbook section:
Individual's Economizing ProblemA. Individuals are confronted with the need to make choices because their wants exceed their means to satisfy them.B. Limited income - everyone, even the most wealthy, has a finite amount of money to spend.
C. Unlimited wants - people's wants are virtually unlimited.
1. Wants include both necessities and luxuries (although many economists don't worry about this distinction).2. Wants change, especially as new products are introduced.
3. Both goods and services satisfy wants.
4. Even the wealthiest have wants that extend beyond their means (e.g. Bill Gates' charitable efforts).
D. The combination of limited income and unlimited wants force us to choose those goods and services that will maximize our utility.
E. Budget line
1. Definition: A schedule or curve that shows the various combinations of two products a consumer can purchase with a specific money income. HOW MUCH CAN YOU BUY OF TWO PRODUCTS IF YOU ONLY HAVE A CERTAIN AMOUNT OF MONEY GIVEN THE PRICES OF THE TWO PRODUCTS?2. The model assumes two goods, but the analysis generalizes to all goods available to consumers.
3. The location of a budget line depends on a consumer's money income, and the prices of the two products under analysis.
4. The slope of the graphed budget line is the ratio of the price of the good measured on the horizontal axis (Pb in the text) to the price of the good measured on the vertical axis (Pdvd). A change in the price of one of the goods will change the slope of the budget line and change the purchasing power of the consumer.
5. The budget line illustrates a number of important ideas:
a. Points on or inside the budget line represent points that are attainable given the relevant income and prices.b. Points outside (up and to the right) the budget line are unattainable.
c. Tradeoffs and opportunity costs - the negative slope of the budget line represents that consumers must make tradeoffs in their consumption decisions; the value of the slope measures precisely the opportunity cost of one more unit of a good under analysis.
d. Limited income and positive prices force people to choose. Note that the budget line does not indicate what a consumer will choose, only what they can choose.
e. Income changes will shift the budget line. Greater income will shift the line out and to the right, allowing consumers to purchase more of both goods. Increasing income lessens scarcity, but does not eliminate it.
MAKING CHOICES: SOCIETY'S ECONOMIZING PROBLEM: Demonstrating the Necessity of Choice -- Production Possibilities Curve
The Economizing Problem: The choices necessitated because society’s economic wants for goods and services are unlimited but the resources available to satisfy these wants are limited.
Scarcity exists because of :
1. Unlimited Wants
2. Limited resources
Because of scarcity we must make choices

Production Possibilities Table
The production possibilities table and curve (or frontier) shows the MAXIMUM POSSIBLE LEVELS OF PRODUCTION.
The graph is based on the following assumptions which "simplify " the real world:
1) fixed resources
The quantity of resources does not change.2) fixed technology
There are no new technological discoveries while we use the graph.
These first two assumptions taken together means that there is no economic growth. We said in an earlier lecture that economic growth is caused by:
- more resources
- better resources
- better technology
3) productive efficiency
Businesses produce at a minimum cost. This means that they are producing as much as they can with the resources available.4) full employment
All available resources are employed (not just labor). This also means that businesses are producing as much as they can.
Our authors use the term "full production" to mean both productive efficiency and full employment. It means that we are producing as much as we can with the resources we have (hence "full production").5) only two goods
To really make the model simple, we'll assume that only two goods are being produced. In this online lecture we'll assume that the economy only produces ROBOTS (industrial robots like they use in a factory, not R2D2 or Three- CPO) and WHEAT, or wheat bread.
Given these assumptions, let's assume that we have the following data.
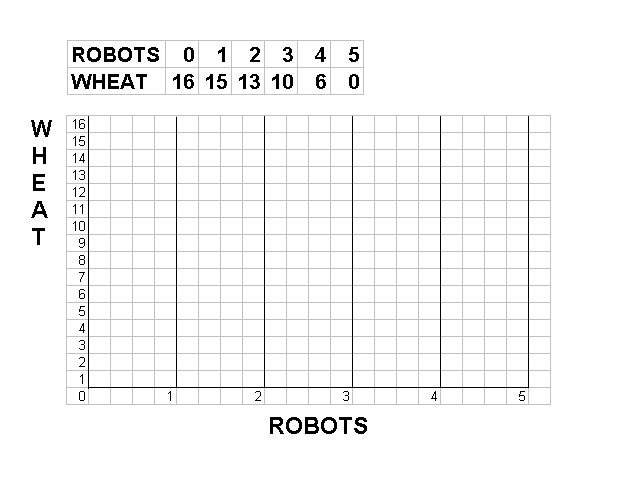
Each combination of robots and wheat (0R and 16W, or 1R and 15 W, or 2R and 13 W, etc.) is the maximum combination that can possibly be produced given our five assumptions.
This data can be graphed giving us a production possibilities curve (PPC).
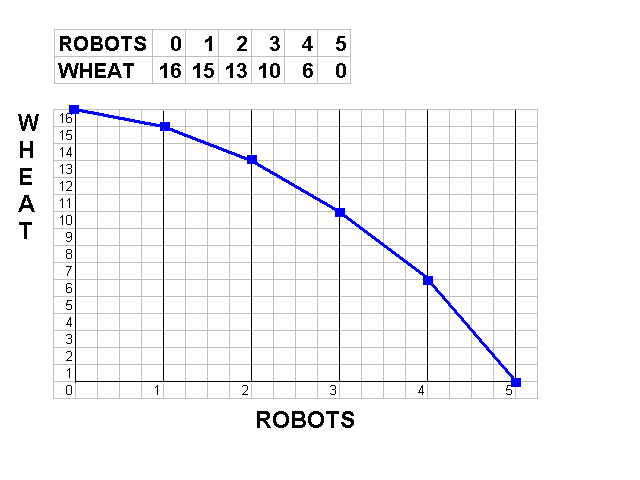
Demonstrating the Necessity of Choice
We can use the production possibilities model to demonstrate many important and fundamental economic principles.
The PPC can demonstrate the fact that because of scarcity, we must make choices. A point outside the PPC (like point A) is unattainable.
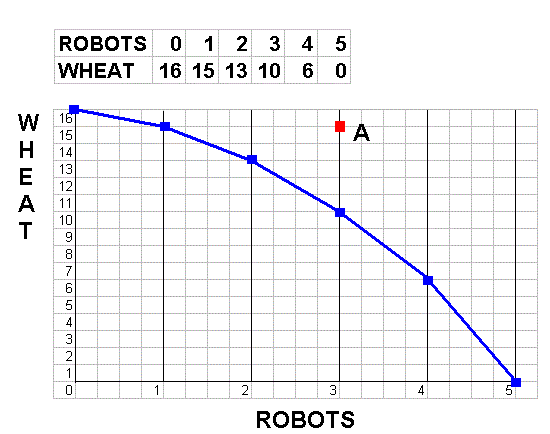
Given our assumptions (you should memorize the assumptions), this economy cannot produce at point A. As we learned in our lesson on graphing above, any point on a graph represents two numbers. Point A then represents 15 Wheat and 3 Robots. This combination (15W and 3 R) is impossible to produce given our assumptions. Above we said the MAXIMUM that could be produced was (15 W and 1 R) or (3 W and 10 R). So we have to make a choice. Or as I would say: "We can't have all the boats we want."
The PPC clearly demonstrates the necessity of choice - we must make choices because of scarcity. (Remember - we have a different definition of "scarcity" -- what is it?)
We can use the PPC model to demonstrate other fundamental concepts in economics:
Opportunity Costs
First, ALL costs in economics are opportunity costs. Economists always mean "opportunity costs" whenever they use the term "cost".
The opportunity cost of any decision is the value of the NEXT BEST ALTERNATIVE that is NOT CHOSEN. Opportunity costs measure what you "give up" when you make a decision or a choice.
Examples:
Calculating Opportunity Costs
Use the PPC below to calculate the opportunity cost of each Robot.

The FIRST Robot cost us how much Wheat? Answer: 1W.
If we are producing 16W than we can't produce any Robots (16W and
0R). When we produce our first Robot, Wheat production drops from 16W
to 15 W. So the first Robot costs 1W.
The SECOND Robot costs how much? Answer: 2W (not 3W)
If we are producing 1R then we can produce 15W. When we produce our
second Robot, Wheat production drops from 15W to 13 W. So the second
Robot costs 2W. (The first two Robots together cost 3W.)
The THIRD Robot costs how much? Answer: 3W
If we are producing 2R then we can produce 13W. When we produce our
third Robot, Wheat production drops from 13W to 10 W. So the second
Robot costs 3W.
The FOURTH Robots costs 4W.
The FIFTH Robot costs 6W.
Law of Increasing Costs
The Production Possibilities Model and also demonstrate the Law of Increasing Costs.
Definition
As you increase production of one product (like Robots), INCREASING amount of another product (like Wheat) must be given up. Above we calculated the cost of producing the first Robot as 1W, the second Robot cost 2W, the third Robot 3W, the fourth robot 4W, and the fifth Robot 6W.
Note how the costs INCREASE for each ONE additional Robot being produced. This is because of the law of increasing costs.
Shape of the PPC -- concave
The bowed-out SHAPE of the PPC is a result of the law of increasing costs. We call this shape "concave to the origin".
Rationale
Why is the law of increasing costs true? Why is the PPC concave to the origin (bowed out)? Why does it cost more to produce the second Robot than to produce the first assuming that the Robots are identical? It makes sense that producing two Robots will cost more than producing one Robot, but why does producing the SECOND Robot (just the second ONE Robot) cost more than producing the FIRST (one) Robot. Or, why does producing two Robots cost MORE THAN TWICE AS MUCH and producing one?
The first robot cost 1W. The Second Robot cost 2W. Producing TWO Robots cost 3W.
Why is the law of increasing cost true?
The rationale is quite simple. Not all resources are the same. Some resources are better at producing Wheat (like farmers) and some resources are better at producing robots (like engineers).
So when we produce 16W and 0R, ALL of our resources (farmers and engineers) are producing wheat.
When we decide to produce the first Robot, we take the best engineers from the wheat fields and put them in the robot factory. Since these engineers are very good at producing Robots we don't need very many of them and Wheat production goes down only a little because engineers re not very good at producing wheat (we lose only 1W).
When we decide to produce the second Robot we need to shift more engineers from the wheat fields, but now all the best engineers are already in the robot factories and we need to take the second-best engineers, and MORE OF THEM, to produce just one more Robot. So Wheat production goes down by a greater amount than when we produced the first Robot.
If we are producing 4R and 10 W, all of our best farmers are in the wheat fields. To produce one more Robot (the fifth) we need to take all of these farmers and put them in the robot factories, because they are not very good at making Robots. so we get one more robot, but we lose a lot of Wheat (6W).
The law of increasing cost is true because resources not not all the same. Some are better at producing Wheat and some are better at producing Robots.
Unemployment
How unemployment increases scarcity (see the 5Es lesson) can be demonstrated with the production possibilities model.
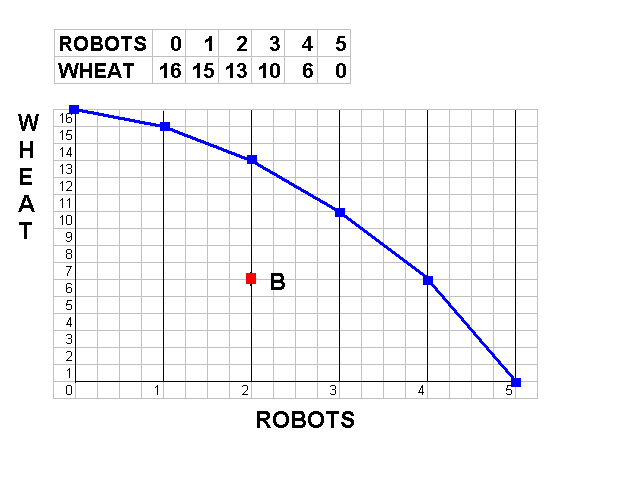
Point "B" represents 6W and 2R. (Remember: any point on a graph represents two numbers.) This is less than the maximum that can be produced with our resources. We can produce 13W and 2R or 6W and 4R. If there are unemployed resources we produce LESS than the maximum possible. This increases scarcity and therefore is not good. The reason why society wants to achieve full employment is because with full employment we produce more boats.
Productive Inefficiency
In a the 5Es lesson above we stated that productive inefficiency causes scarcity because less is produced. On our PPC this could be represented by point B.

If this economy has all of its resources employed (full employment) BUT if all of the farmers are working in the robot factories and if all of the engineers are in the wheat fields then even with full employment, less than the maximum possible will be produced. Remember that one way to achieve productive efficiency is to "use resources where they are best suited". If this is not done, less will be produces -- like point "B" above.
Economic Growth
In Macroeconomics we study three main issues:
We can use the production possibilities model to demonstrate how economic growth can reduce scarcity.
Above we said:
Economic Growth is an increase in the ABILITY to produce goods and services. [MEMORIZE THIS!]
This type of Economic Growth is caused by a society getting:
a) more resources,
b) better resources, or
c) better technology.
How does economic growth reduce scarcity? If we only had more resources we could produce more goods and services and satisfy more of our wants. This will reduce scarcity and give us more satisfaction (more good and services). All societies therefore try to achieve economic growth.
Here we will expand our discussion of economic growth.
Three Definitions of Economic Growth
(1) Increasing our POTENTIAL OUTPUT
I like to call this increasing our ABILITY to Produce. This is the definition we used in the 5Es lesson. This is the most fundamental definition of economic growth. It is the type of economic growth used on our 5Es diagram.
We can increase our ABILITY to produce goods and services (or increase our POTENTIAL GDP) if we get:
- more resources
- better resources, and
- better technology
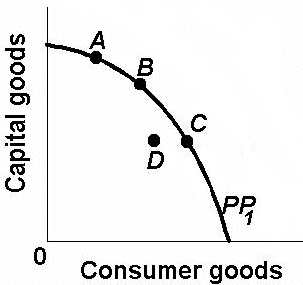
Since this increase maximum output that we are able to produce it shifts the PPC outward. On the graph below, economic growth would cause the PPC to move from PP1 to PP2.
This doesn't necessarily mean that the economy IS producing more, just that it CAN produce more. To achieve our new potential levels of output we also need full employment and productive efficiency. It could be possible to have this type of economic growth so that we CAN produce the quantities represented by point E, but if there is unemployment and productive inefficiency we would be at a point beneath this new curve (maybe point C). So we may get new resources or new technology so we CAN produce more (point E on PP2), but if we don't use the new resources (i.e. we have unemployment) or if we don't use the new technology (i.e. we have productive inefficiency) , we could remain at (point C).
(2) Increasing Output
The most commonly used definition of economic growth is simply "producing more". (Later we will call this INCREASING REAL GDP.) When an economy increases its output it is often said to have achieved economic growth. But if by producing more we are simply ACHIEVING OUR POTENTIAL, then we could also say that it is REDUCING UNEMPLOYMENT or ACHIEVING PRODUCTIVE EFFICIENCY. On our graph this would be represented by moving from point D to a point on the curve: A, B, or C). I prefer NOT to call this economic growth - it is really reducing unemployment or achieving productive efficiency.
(3) Increasing Real GDP per capita
Another definition of economic growth is an increase in output per capita. This means increasing output per person. Output per capita is calculated by dividing output by the population.
Whenever you hear the term "economic growth", try to figure out if they are discussing real economic growth (more resources, better resources, or better technology) which will shift the production possibilities outward INCREASE OUR POTENTIAL, or are they talking about producing more by reducing unemployment or achieving productive efficiency - i.e. ACHIEVING OUR POTENTIAL.
A Shrinking PPC?
Is it possible for a country's PPC to shrink?
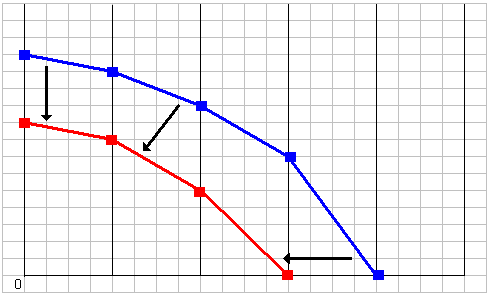
Yes, but how? We already know that economic growth is caused by:
- more resources
- better resources, and
- better technology
Then the PPC can DECREASE if we have FEWER RESOURCES. This could be caused by war, famine, environmental degradation, and numerous other causes.
Nonproportional Growth
What would cause economic growth to look like the graph below (from the black PPC to the red PPC)?
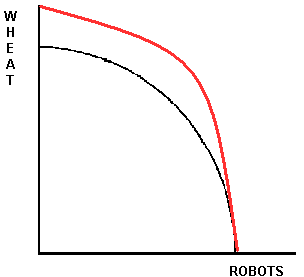
If economic growth is caused by more resources, better resources, and better technology, they a better wheat seed technology would increase the ability to produce wheat but have no effect on the ability to produce robots.
BUT - look at what happens if with new wheat seed technology moves this economy from point A to point B.
The result is that with the new wheat seed technology more wheat AND more robots can be produced. WHY? Because with the new wheat seed fewer farmers can produce more wheat and this frees up some farm labor that can now go work in the robot factory - producing more robots.
Present Choices, Future Possibilities
How much we can produce in the future depends on WHAT we produce today. if economic growth is caused by:
- more resources
- better resources, and
- better technology
Then if we use our resources TODAY to produce more capital (manufactured resources), we will have more resources in the future so we will be able to produce more goods and services.
Which point on the graph below, A, B, or C, would give this economy the greatest potential (most economic growth) in the future? Which point produces the most capital resources?

Remember, any point on a graph represents two numbers. Point A represents the more capital goods than the other points, so if we produce at point A we will get more future growth. But this comes at a cost (opportunity cost). Point A represents more capital goods, but LESS CONSUMER GOODS.
Since World War II, the country of Japan has been operating near point A on its PPC. Japan has been producing a lot of capital good and has achieved much economic growth (its curve has shifted out a lot). The cost of this growth is fewer consumer goods. The average Japanese income is about the same as that in the US, but they have fewer consumer goods in their homes.
Since World War II, the United States has been operating closer to points B or C on its PPC. We have been producing and consuming many consumer goods, but we have not been adding to our stock of capital resources as quickly as we could. So our economy has grown slower and the curve has shifted out only a little.
The choices we make today affect how much we are able to produce in the future.
Optimum Product Mix? (Allocative Efficiency?)
Which point is "best" for society, A, B or C? By "best" we mean which combination will maximize our satisfaction by achieving allocative efficiency? We discussed allocative efficiency in our 5Es lesson.)

THE QUESTION CANNOT BE ANSWERED BY USING THIS GRAPH. Many students select point B because it is in-between the other two, but the production possibilities model is not designed to demonstrate allocative efficiency. Allocative efficiency depends on what the people want. If Americans want more consumer goods and if the Japanese want more economic growth then both points C and A could be allocatively efficient. In our lesson on graphing we said that economic models are abstractions and are designed to demonstrate some, but not all, issues.
So how do we find the allocatively efficient quantity of a good? O, how do we make good decisions? Economists have a model to show how to make good decisions called "marginal analysis" or "benefit-cost analyses".
Most decisions concern a change in current conditions. I seldom have to decide "how many days will I ski this season", but I often have to decide "should I go skiing today". When we talk about a change we are using "marginal analysis". The term "marginal" means "extra" or "additional". To make good decision we need to compare the marginal (extra) benefits of the desions with the marginal (extra) costs. As long as the marginal benefits are greater then the marginal costs it is a good decision.Remember, in economics all costs are opportunity costs. So the cost of any decision is the value of the nest best alternative that must be sacrificed.
Benefit-Cost Analysis, or marginal analysis then is the selection of ALL possible alternatives where the marginal benefits are greater than the marginal cost. to make the best (optimal) decision you should:
select all alternatives where the marginal benefits are greater than the marginal costs.
up to where the marginal benefits equal the marginal costs.
but never where the marginal benefits are less than the marginal costs.Benefit-Cost (Marginal) Analysis
select all where MB > MC
up to where: MB = MC
but never where: MB < MCWhether the decision is personal or one made by business or government, the principle is the same. Marginal analysis can be used by all to make the best (optimal) decisions.
If we are discussing allocative efficiency then the optimal decision is to produce, or consume, the quantity that maximizes society's satisfaction. The marginal benefit then is the extra (additional) benefit of consuming one more unit of some good or service; the change in total benefit when one more unit is consumed. The marginal cost is the extra (additional) cost of producing one more unit of output.
Marginal Benefit = Marginal Cost Rule
The point at which the society's utility is optimized is where the MB=MC. Because at this point, society has already consumed all alternatives where the MB>MC. If the MB>MC then the activity, scope, or output of a decision should be increased until it reaches this point - or comes very close to it. This point will yield the maximum net benefit to society. If marginal benefit exceeds marginal cost, then the project is too modest, and could be increased thereby increasing the net benefit to society; however, if the marginal cost exceeds the marginal benefit, then the project will decrease the net benefit to society and should be decreased in scope.
The information above is true because marginal benefits decline, and marginal costs, increase as we expand the scope of the activity, i.e. as we do more. Marginal benefits decline due to the law of diminishing marginal utility (discussed above when we explained how equity increases society's satisfaction in the Pres. Obama example) and marginal costs increase doe to the law of increasing costs (discussed above when we explained the shape of the production possibilities curve).
See "optimal allocation", pp. 13-14 of the textbook.
Key Question 1-11
Specify and explain the typical shapes of the marginal-benefit and marginal-cost curves. How are these curves used to determine the optimal allocation of resources to a particular product. If current output is such that marginal cost exceeds marginal benefit, should more or fewer resources be allocated to this product? Explain.ANSWER: The marginal benefit curve is downward sloping, MB falls as more of a product is consumed because additional units of a good yield less satisfaction than previous units. The marginal cost curve is upward sloping, MC increases as more of a product is produced since additional units require the use of increasingly unsuitable resource. The optimal amount of a particular product occurs where MB equals MC. If MC exceeds MB, fewer resources should be allocated to this use. The resources are more valuable in some alternative use (as reflected in the higher MC) than in this use (as reflected in the lower MB).
There are several important points to keep in mind. First we are discussing MARGINAL benefits and MARGINAL costs, NOT TOTAL benefits and TOTAL costs. Of course, if total benefits equal total costs there would be no net gain and this would not be a good decision. But when marginal benefits equal marginal costs we have the maximum net gain possible. For example, in microeconomics we learn that to maximize profits businesses should produce the quantity where: marginal revenue = marginal cost. If MR = MC then what will the profits be . . . . ?
If you said that profits would be MAXIMIZED (as large as possible) then you were correct. If you said that the profits would be ZERO, then you are still thinking about TOTAL benefits (revenue) and TOTAL costs.
The second important point to keep in mind is that we must ignore fixed or sunk costs. A fixed cost is any cost that does not change as a result of the decision. Since they do not change no matter what is decided, then they do not matter and should not be considered. For example, if the decision is: "Should I go to class today? ", the marginal benefits would include doing better on the next exam and the marginal (opportunity) cost might be not being able to sleep longer. what about the tuition that yo paid for the course? Should tat be included in the decision making process?
NO! The tuition that you paid is a sunk (fixed) cost. It will not change whether you go to class or not. If you go to class you do not have to pay more. If you skip class you will not get a refund. No matter what you decide you already paid tuition and it therefore does not matter. BUT, if your decision is "should I register for and take this course?", then the additional tuition that you would have to pay if you took the course IS a marginal cost and needs to be considered.
A third point to remember is that all costs are opportunity costs. If you were offered a FREE trip to Europe this summer - all expenses paid for three months, could you "afford" to go? I could not, because even though there are no expenses associated with the trip there are "costs". If I went to Europe for three months in the summer I would not be able;e to teach summer school and I would lose the opportunity to make that additional income. this is a "cost" of going on the free trip.
Think of a decision that you currently have to make. What are the marginal benefits and the marginal costs? Are there any sunk costs that do not matter?
FROM THE TEXTBOOK: Consider This … Did Gates, Winfrey, and Rodriguez Make Bad Choices When they Dropped Out of College?
1. The college decision requires weighing future benefits, including projected lifetime earnings, against present costs, including direct costs (tuition) and indirect costs (forgone wages).2. For Gates, Winfrey, Rodriguez, and others like them, the opportunity cost of college was extremely high, and it would be hard to argue that they made a wrong decision. Their marginal cost of staying in college was all the income they would NOT be earning.
3. Despite the success of celebrities such as Bill Gates, Oprah Winfrey, and Alex Rodriguez, in general those attending and completing college will earn greater lifetime earnings (about 50% more) than those holding only high school diplomas. this is why YOU are in class right now instead of working at Wal-Mart: The marginal cost of staying in college for you is the lost income from any job that you can get right now AND the tuition/etc. that you need to pay to attend Harper. The marginal benefits of staying in college is the higher expected lifetime earnings. If the MC of attending college are lower than the MB -- then stay in school. But, if you could make millions of dollars now if you quit college -- then quit now.
Multiple Choice Problems
The following data are for a series of increasingly extensive flood control projects:
Total cost
per yearMC Total benefit
per yearMB No project
$ 0
------------ $ 0
------------ Plan A
levees
10,000
20,000
Plan B
small reservoir
24,000
34,000
Plan C
medium reservoir
44,000
42,000
Plan D
large reservoir
72,000
44,000
1. Refer to the above data. For Plan D marginal costs and marginal benefits are:
A. $72,000 and $64,000 respectively.B. $28,000 and $2,000 respectively.
C. $24,000 and $18,000 respectively.
D. $16,000 and $28,000 respectively.
2. Refer to the above data. On the basis of benefit-cost (marginal) analysis government should:
A. undertake Plan A.B. undertake Plan B.
C. undertake Plan C.
D. undertake Plan D.
3. Plan C above entails:
A. marginal benefits in excess of marginal costs.B. fewer spillovers than either Plan A or Plan B.
C. an overallocation (too much) of resources to flood control
D. an underallocation (too little) of resources to flood control.
(See answers below)
ANSWERS:
Total cost
per yearMC Total benefit
per yearMB No project
$ 0
-- $ 0
-- Plan A
levees
10,000
10,000
20,000
20,000
Plan B
small reservoir
24,000
14,000
34,000
14,000
Plan C
medium reservoir
44,000
20,000
42,000
8,000
Plan D
large reservoir
72,000
28,000
44,000
2,000
1. For Plan D marginal costs and marginal benefits are:
B. $28,000 and $2,000 respectively.Be sure that you can calculate MB and MC. If you need help ask on the Discussion Board
2. Refer to the above data. On the basis of benefit-cost (marginal) analysis government should:
B. undertake Plan B.Do all options as long as the MB are greater then the MC (MB>MC)
3. Plan C above entails:
C. an overallocation (too much) of resources to flood controlFor plan C the MB are less than the MC (MB<MC). this means tat too many resources are being used on these flood control projects. To say this another way, IF the MB are less than the MC it means that you have other uses for these resources that will give you more benefits. Remember, the MC of any decision is the benefits of other alternatives that you are not doing.
One Last Thing . . .
We said that point "A" on the graph below is UNATTAINABLE

In Chapters 5 and 20 we will learn that with international trade, ALL countries can consume at a point beyond their production possibilities. Yes, with international trade, all countries can consume more than they could without trade. We said in the 5Es lecture that trade allows "resources to be used where they are best suited" and therefore helps us achieve productive efficiency. With productive efficiency caused by international trade the world produces more. This reduces scarcity.