|
|
I. The following figures and graphs illustrate what we learn in chapters 10, 12, 14, 15, and 16
II. What we learned in chapters 10 and 12
C. Chapter 14 (part of 16)
III. In chapter 10 of the textbook
1. Investment consists of spending on new plants, capital equipment, machinery, inventories, construction, etc.2. The expected rate of return is found by comparing the expected economic profit (total revenue minus total cost) to the cost of investment to get the expected rate of return. The text's example gives $100 expected profit on a $1000 investment, for a 10% expected rate of return. Thus, the business would not want to pay more than a 10% interest rate on investment. Remember that the expected rate of return is not a guaranteed rate of return. Investment carries risk.
3. The real interest rate, i (nominal rate corrected for expected inflation), determines the cost of investment.
a. The interest rate represents either the cost of borrowed funds or the opportunity cost of investing your own funds, which is income forgone.b. If real interest rate exceeds the expected rate of return, the investment should not be made.
4. Investment demand schedule, or curve, shows an inverse relationship between the interest rate and amount of investment.
a. As long as expected return exceeds the interest rate, the investment is expected to be profitableb. Figure 10-5 shows the relationship when the investment rule is followed. Fewer projects are expected to provide high return, so less will be invested if interest rates are high.
Figure 10.5
5. graph
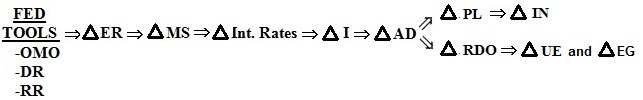
IV. Putting chapters 10, 12, and 14 (part of 16) together.
IF the MS increases:
FIRST: Chapter 14 (part of 16) THEN: Chapter 10 FINALLY: Chapter 12 If the MS increases: If the interest rates decline: If investment increases:
V. Chapter 15: The Money Market
VI. Chapter 16 - How the Federal Reserve (the "Fed") controls the money supply: FED TOOLS
VII. PUTTING IT ALL TOGETHER:
FIRST: Chapters 15 and 16 SECOND: Chapter 14 (part of 16) THIRD: Chapter 10 FINALLY: Chapter 12 To increase the MS the Fed must increase the ER of
banks. Then banks could make more loans and create more
money. To do this they would use an easy money
policy. Easy Money Policy: If the MS increases: If the interest rates decline: If investment increases:
![]() DR)
DR)![]() RR)
RR)
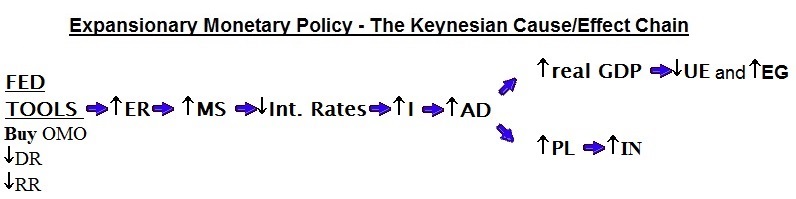
SUMMARY: Easy Money Policy (expansionary Monetary Policy)
The numbers on the graph refer to:
1. Fed uses one of its tools to increase the Money Supply
- buy securities on the open market (OMO sell)
- decrease the DR (
DR)
- decrease the required reserve ratio (
2. The increase in the money supply causes interest rates to decrease
3. The decrease in interest rates causes the amount of investment to go up (Note the investment demand curve does NOT shift; it is a movemnent down along the investment demand curve)
4. More investment causes an increase in aggregate demand (AD)
5. The increase in AD causes a higher level of real GDP resulting in more economiuc growth and less unemployment (the goal of an easy money policy) and a higher price level resulting in more inflation
FIRST: Chapters 15 and 16 SECOND: Chapter 14 (part of 16) THIRD: Chapter 10 FINALLY: Chapter 12 To decrease the MS the Fed must decrease the ER of
banks. Then banks could make FEWER loans and create more
money. To do this they would use a tight money
policy. Tight Money Policy: If the MS decreases: If the interest rates increase: If investment increases:
![]() DR)
DR)![]() RR)
RR)
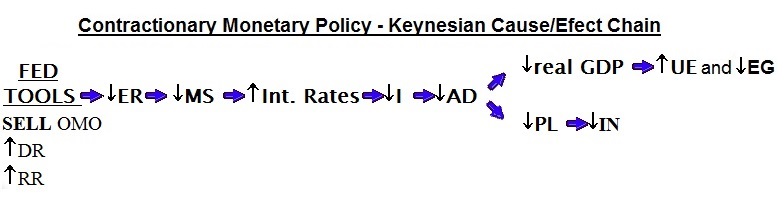
SUMMARY: Tight Money Policy (Contractionary Monetary Policy) Graphs
The numbers on the graph refer to:
1. Fed uses one of its tools to decrease the Money Supply
- sell securities on the open market (OMO sell)
- raise the DR (
DR)
- increase the required reserve ratio (
2. The decrease in the money supply causes interest rates to increase
3. The increase in interest rates causes the amount of investment to go down (Note the investment demand curve does NOT shift; it is a movemnet up along the investment demand curve)
4. Less investment causes a decrease in aggregate demand (AD)
5. A decrease in AD causes a lower price level (except for the ratchet effect) resulting in lower inflation (the goal of a tight money policy) and a lower level of real GDP resulting in less economiuc growth and more unemployment