1. Goal of businesses: Maximize Profits  |
Outline
5a Market Failures |
I. Structural Adjustment Policies
1. Privatization
2. Promotion of Competition
3. Limited and Reoriented Role for Government
4. Price Reform: Removing Controls
5. Joining the World Economy
6. Macroeconomic Stability
II. Review: Supply, Demand, and Efficiency [See: The supply and demand model and allocative efficiency]
2. Therefore,they will produce where:
- the Market Equilibrium quantity
- the quantity where Qs=Qd
- the is "what we get"
- Graphically:
3. Assumptions: pure capitalism (for what is capitalism see: chapter 2)
B. WHAT WE WANT: ALLOCATIVE EFFICIENCY
1. Review :a. Allocative Efficiencydefinition - using our limited resources to produce:
- The quantity of goods and services that maximizes society's satisfaction
- using resources to produce more CDs that people want and fewer cassette tapes that they don't want
- no shortages and no surpluses
b. Benefit-Cost Analysis
definition -the selection of ALL possible alternatives where the marginal benefits are greater than the marginal costselect all where: MB > MC
up to where: MB = MC
but never where: MB < MCc. Allocative Efficiency is achieved where: MSB=MSC
(1) define Marginal Social Benefits (MSB)(2) define Marginal Social Costs (MSC)
(3) therfore if society gets
all quantities where: MSB > MSC
up to where: MSB = MSC
but never where: MSB < MSCthis will be the quantity where society's Satisfaction will be maximized or the allocatively efficient quantity
2. Graphically:
C. THEREFORE:
1. Businesses will produce the profit maximizing or market equilibrium quantity - the quantity where Qd=Qs2. Society wants the allocatively efficient quantity - the quantity where MSB=MSC
3. WHAT WE GET = WHAT WE WANT if:
b. Market Demand = Marginal Social Benefits (D=MSB)1. law of diminishing marginal utility
2. assuming no positive externality (or spillover benefit)s D=MSBc. Market Supply = Marginal Social Costs (S=MSC)
1. law of increasing costs
2. assuming no negative externality (or spillover cost)s S=MSCD. Competitive Markets and Allocative Efficiency (MSB=MSC)
1. if there are no negative externality (or spillover cost)s, then S = MSC,2. if there are no positive externality (or spillover benefit)s, then D = MSB,
3. Graphically:
4. Then: WHAT WE GET = WHAT WE WANT and market economies achieve allocative efficiency
In a market economy with no positive externality (or spillover benefit)s and no negative externality (or spillover cost)s:
the profit maximizing or market equilibrium quantity
(what we get)WILL BE THE SAME AS
the allocative efficient quantity
(what we want)
III. Market Failures (when MSB do not equal MSC):
A. Governments Causing Allocative Inefficiency
("Application: Government Set Prices", pp. 59-62)
2. Price Floors (Supports) and Allocative Inefficiency
B. Correcting Market Failure to Achieve Allocative Efficiency
1. Negative Externality (or spillover costs)
CLASS: A negative externality (or spillover cost) occurs if some of the costs of producing and consuming a product "spillover" onto a third party who does not benefit.
Example: A paper manufacturer dumps toxic chemicals into a river killing the fish sport fishers seek.
b. examples
c. markets and inefficiency:
ON A GRAPH SHOW: 2) MSC when there are NO negative
externality (or spillover cost)s (producer pays
ALL costs) 3) What happens to S if there ARE negative
externality (or spillover cost)s (the producer
can AVOID some costs) 4) What happens to P, Q, and efficiency
WITH negative externality (or spillover
cost)s? 5) RESULT:
1) S and D for a product
(assume D=MSB, i.e. no positive externality
(or spillover benefit)s)
d. correcting for negative externality (or spillover cost)s: What can the government do?
2) policies
e. APPLICATION: SHOULD GAS PRICES BE HIGHER?
|
Arguing the Upside of High Gas Prices Morning Edition, September 22, 2005 One writer believes gas prices actually should be high. Steve Inskeep talks with James Surowiecki, a financial columnist for The New Yorker who says a 50-cent gas tax would make drivers pay for the real cost of cars on the road and make business cater to the fuel-conscious. http://www.npr.org/templates/story/story.php?storyId=4858826 |
2. Positive Externalities (or spillover benefits)
CLASS: A positive externality (or spillover benefit) occurs if some of the benefits of producing or consuming a product "spillover" onto a third party who does not have to pay
Example: A beekeeper benefits when a neighboring farmer plants clover.
b. examples
c. markets and inefficiency:
ON A GRAPH SHOW: a) MSB and alloc eff. P and Q with NO
positive externality (or spillover
benefit)s b) What happens to D if there are positive
externality (or spillover benefit)s and a consumer
can benefit without paying? c) So what happens to P, Q, and efficiency
WITH positive externality (or spillover
benefit)s? d) RESULT: an UNDERallocation of
resources
d. Correcting for positive externality (or spillover benefit)s - What can the government do?
2) HOW?
1) exclusion principle does not apply
2) free-rider problem
The inability of potential providers of an economically desirable but indivisible good or service to obtain payment from those who benefit because the exclusion principle is not applicable.
3) indivisible good / nonrival
b. examples
c. markets and inefficiency
too little (none) will be produced without the government
d. role of government:
allocating resources to public goods
e. Are the following public goods? If not why does the government provide them?
5b The Economic Role of Government and Government Finance |
III. Review: Capitalism, Markets, and Efficiency
A. Capitalism and Limited Government
- private property and economic growth
- markets and prices
- role of self interest
- freedom of enterprise and choice
- competition = capitalism
- limited role for government
B. Why limited government?
1. Businesses will produce the profit maximizing or market equilibrium quantity - the quantity where Qd=Qs
2. Society wants the allocatively efficient quantity - the quantity where MSB=MSC
3. WHAT WE GET = WHAT WE WANT if:
a. Market Demand = Marginal Social Benefits (D=MSB)1. law of diminishing marginal utility
2. assuming no positive externality (or spillover benefit)s D=MSBb. Market Supply = Marginal Social Costs (S=MSC)
1. law of increasing costs
2. assuming no negative externality (or spillover cost)s S=MSC4. Competitive Markets and Allocative Efficiency (MSB=MSC)
a. if there are no negative externality (or spillover cost)s, then S = MSC,b. if there are no positive externality (or spillover benefit)s, then D = MSB,
c. Graphically:
4. Then: WHAT WE GET = WHAT WE WANT and market economies achieve allocative efficiency
In a market economy with no positive externality (or spillover benefit)s and no negative externality (or spillover cost)s:
the profit maximizing or market equilibrium quantity
(what we get)WILL BE THE SAME AS
the allocative efficient quantity
(what we want)
IV. Economic Functions of Government
A. Five Reasons for Government Involvement1. legal and social framework
2. maintaining competition
3. redistribution of income
(correcting market failure to achieve equity)
4. reallocation of resources
(correcting market failure to achieve efficiency)
5. stabilizing unemployment and inflation and promoting economic growthproviding the legal foundation and a social environment conducive to the effective operation of the market system1. review competitiona. large numbers
b. free entry and exit2. the problem with monopolies
a. higher prices
b. smaller quantities
C. allocative and productive inefficiency3. role of government
a. preventing monopolies -- antitrust laws
b. regulating monopolies -- natural monopoliesD. Correcting Market Failure to Achieve Equity
1. define equity
2. how does equity affect society's satisfaction?
3. examples of income distributionUS: Table
World:4. Growing inequality in the US
- BBC News Article: http://www.bbc.co.uk/news/world-us-canada-24039202
- 30 minute interview with Robert Reich: http://live.huffingtonpost.com/r/segment/robert-reich-jacob-kornbluth-inequality-for-all-/521d105b78c90a630700013e
5. role of government
a. transfer payments
b. market intervention
c. progressive income taxesE. Correcting Market Failure to Achieve Allocative Efficiency
Four circumstances (there are more) when a market economy results in allocative inefficiency:
- Lack of Competition (Microeconomics class)
- Negative Externalities
- Positive Externalities
- Public goods
F. Stabilization (to be studied in units 2 and 3)
1. unemployment
2. inflation
3. role of governmenta. fiscal policy
b. monetary policy
V. Government Finance
I. Federal FinanceA. Federal Expenditures
2009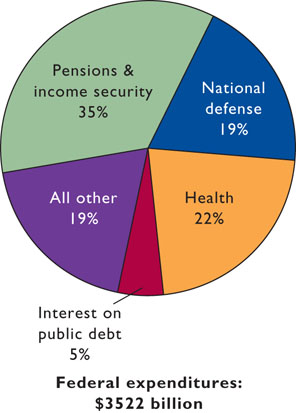
1. pensions and income security
2. national defense
3. health
4. interest on the public debt
5. other
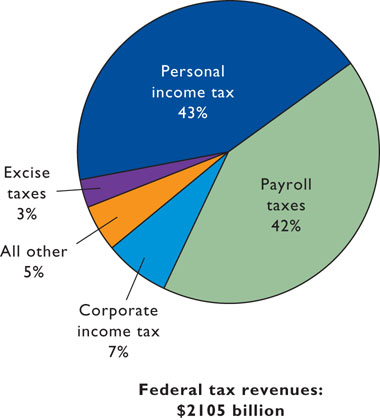
B. Federal Tax Revenues
2009
1. personal income tax
2. payroll taxes
3. corporate income tax
4. excise taxesC. State and Local Finance
1. state expenditures and receipts [staexp.gif /starev.gif / 2007exp / 2007rev]
2. local expenditures an receipts [locexp.gif / locrev.gif / 2007exp / 2007rev ]D. Regressive, Proportional, and Progressive Taxes
WASHINGTON
House Dems hit on sales tax proposal
House Democrats plan to attack GOP candidates nationwide on their support of a national sales tax proposal, hoping the issue will help their attempt to take over the House.
Democrats think a national sales tax would mean that lower-income families will pay more of the country's tax burden and have been running advertisements attacking GOP candidates for supporting the idea. "We think that Republican candidates and Republican incumbents who are supporting this legislation must respond to their constituents about how they're going to deal with moving the tax burden," said Rep. Robert Matsui, D-Calif.
From wire reports
Northwest Herald
Wed., Oct 27, 2004, page 3A
Letters to the Editor
Logan Scott
Breckenridge
June 27, 2006Several friends have asked: "Why should we pay sales tax on lift tickets? I don't want to pay a $14 sales tax on my season pass. Don't we pay enough already?" Perhaps a better question would be: "How might we use the revenue?"
Summit County has a highly regressive tax structure in the form of its sales tax on food for home consumption, i.e. the tax we pay on groceries at the supermarket. In most states, such a tax is in fact illegal. According to the USDA, a budget minded family of four averages $153/week on groceries or $7,966/year. Our 5 percent groceries sales tax adds about $400 to that cost. For someone earning $10/hour, that is about one week's wages. Clearly, the sales tax on food places a disproportionate burden on the working poor who are the foundation of our tourist industry.
Imposing a 4 percent sales tax on lift tickets would provide a revenue stream that could be used to reduce or eliminate groceries tax while maintaining a neutral position on overall sales tax collections. A 4 percent sales tax on lift tickets would help shift the burden from those who can least afford it to those who can and help make Summit County a more family friendly place to live.
Other possible uses? How about funding affordable housing initiatives specifically earmarked for police, school teachers, firemen, and other persons vital to our community. Affordable daycare continues to be a major concern, especially with the impending loss of Kinderhut triggered by VRI actions. Do we really want to continue providing VRI with a free ride on sales taxes and 6.7 million dollar subsidies to build gondolas? I think not. It is time for a lift ticket tax.
http://www.summitdaily.com/article/20060627/LETTER/106270043&SearchID=73249722340253
E. Personal Income Tax
1. taxable income
2. progressive taxa. marginal tax rateshttp://economics.about.com/b/2012/11/26/a-friendly-reminder-about-marginal-tax-rates.htmb. average tax rates
3. Fed. Income Tax Rates
TAX SCHEDULE:
http://www.irs.gov/
For 2012, tax brackets are as follows for an individual in the U.S.:10% on taxable income from $0 to $8,70015% on taxable income over $8,700 to $35,350
25% on taxable income over $35,350 to $85,650
28% on taxable income over $85,650 to $178,650
33% on taxable income over $178,650 to $388,350
35% on taxable income over $388,350
E. International Comparisons
F. Distribution of the Tax Burden
- http://mercatus.org/publication/tax-burden-among-varying-income-percentiles
- http://www.ntu.org/tax-basics/who-pays-income-taxes.html
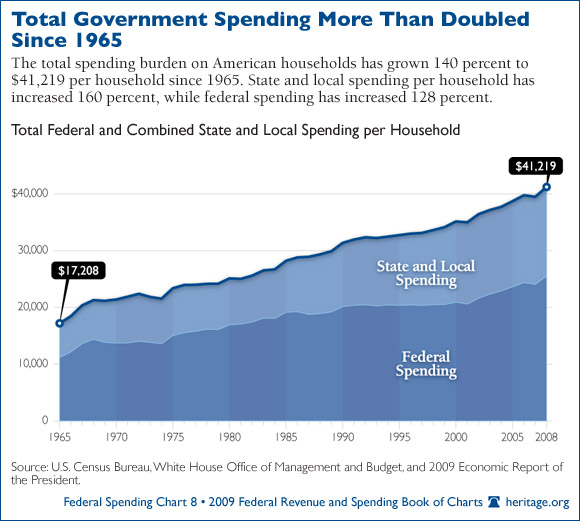
G. Government Growth
1. ways to measure government size
2. growth of TOTAL government expenditures
3. BUT:
a. purchases vs. transfer payments
(exhaustive and nonexhaustive expenditures)much of the growth has been the growth of transfer payments
b. growth of government expenditures AS A % OF GDP
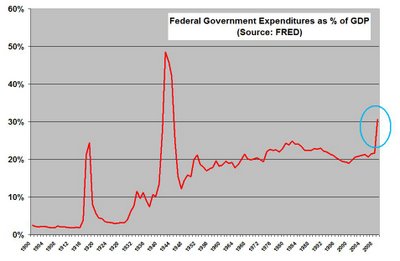
Notice how goverernment spending as a % of total spending DID NOT DOUBLE since 1965, but it is growing