Chapter 8
Macroeconomic Goal: Economic Growth
Lectures
For Online Lecture see: http://www.harpercollege.edu/mhealy/eco212i/lectures/ch8-18.htm
Recession is over: http://money.cnn.com/2009/10/29/news/economy/gdp/index.htm
I. Introduction
A. Macroeconomic Goals
1. Full Employment
2. Low Inflation
3. Economic
Growth
II. Definitions of Economic Growth
Note: in chapter 8 the textbook gives two definitions and in chapter
one a third definition
A. Definitions of economic growth
- INCREASING OUR POTENTIAL OUTPUT (Ch. 1 - an increase in
the ability to produce)
- ACHIEVING OUR POTENTIAL OUTPUT (Ch 8 an increase in real
GDP)
- Increase in real GDP PER CAPITA
1. INCREASING THE POTENTIAL REAL GDP (increasing
our ABILITY to Produce, Ch. 1, 5Es Definition)
a. "economic growth" on the 5Es chart
b. production possibilities curve
c. AD and AS model: AS
causes:
In the 5 Es lecture we said that economic
growth is caused by:
- more resources
- better resources, or
- better technology
An increase in the production possibilities
curve is caused by having more resources, better
resources, or better technology.
An increase in AS is caused by:
- a decrease in the price of
resources
- an increase in productivity
- lower business taxes and government red
tape
These are all really the same thing.
d. LRAS Model (long run AS )
more later
2. ACHIEVING THE POTENTIAL REAL GDP
Increasing Real GDP (producing more, definition often used in
the news)
"Ch. 8 definition"
a. achieving "full employment" and "productive
efficiency" (5Es)
b. production possibilities curve
c. AD and AS model: AD
3. increasing GDP per capita
- This definition is superior if comparison of living
standards is desired. For example, China's 2001 GDP was
$1131 billion compared to Denmark's $166 billion, but per
capita GDP's was $890 and $31,090 respectively.
- Growth in real GDP does not guarantee growth in real
GDP per capita. If the growth in population exceeds the
growth in real GDP, real GDP per capita will fall.
B. A new model to illustrate the first definition
(INCREASING THE POTENTIAL REAL GDP)
The Long Run AS (LRAS) Model
1. What is the LRAS curve?
AS when all resources can be changed
a. What happens IN THE LONG RUN if there is an
increase in the short run AD?
(1)First, if there is an increase in
AD (from AD1 to AD2)
(2) then, the price level will increase from P1 to
P2
(3) a higher price level will cause an increase in
the price of resources
(4) higher resource prices is a determinant of AS,
so AS decreases from AS1 to AS2
(5) RESULT: in the long run the level of real
domestic output will stay at the full employment level
(Qf)
b. What happens in the long run if there is an
initial DECREASE in short run AD?
(1) If there is an decrease in AD
(from AD1 to AD2)
(2) then the price level will decrease from P1 to
P2
(3) a lower price level will cause an decrease in
the price of resources
(4) lower resource prices is a determinant of AS,
so AS increases from AS1 to AS2
(5) RESULT: in the long run the level of real
domestic output will stay at the full employment level
(Qf)
2. With this new model in increase in economic growth
will be represented as:
NOTE: this is INCREASING THE POTENTIAL GDP
III. Economic Growth in the United States
A. Growth is an important economic goal because it
means more material abundance and ability to meet the economizing
problem. Growth lessens the burden of scarcity.
That is why we study it.
B. The arithmetic of growth is impressive.
- Using the "rule of 70," a growth rate of 2 percent
annually would take 35 years for GDP to double,
- but a growth rate of 4 percent annually would only take
about 18 years for GDP to double.
- The "rule of 70" uses the annual rate of change, divides
it into 70, and the result is the number of years it takes the
underlying quantity to double.)
- Note:
- small changes in the annual
percent growth of GDP results in large changes in GDP
over time
- know the "rule of
70"
C. Main sources of growth are increasing inputs or
increasing productivity of existing inputs.
1. About one-third of U.S. growth comes from more
inputs.
2. About two-thirds comes from increased
productivity.
- Note:
- we said economic growth is
cause by:
- more
resources
- better resources =
greater productivity
- better technology =
greater productivity
- here the authors are
discussing an INCREASE in POTENTIAL GDP
E. Growth Record of the United States (Table 8.1) is
impressive.
Table 8.1
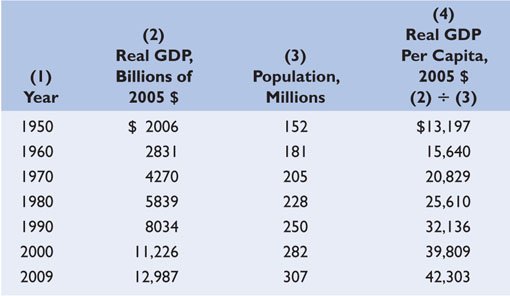
1. Real GDP has increased over six fold since 1950, and
real per capita GDP has risen over threefold. (See columns 2
and 4, Table 8.1)
2. Rate of growth record shows that real GDP has grown
about 3.2 percent per year between 1950 and 2009, and real GDP
per capita has grown about 2 percent per year. But the
arithmetic needs to be qualified.
- impoved products and services
- added leisure (shorter average work week)
- other impact on the environment, etc.
IV. Modern Economic Growth
A. Modern economic growth is characterized by
sustained ongoing increases in living standards that can cause
dramatic increases in the standard of living within a
generation.
B. Economic historians informally date the start of the
Industrial Revolution to the year 1776, when Scottish inventor
James Watt perfected a powerful and efficient steam
engine.
Note:
- there was little to no growth in
living standards from the beginning of time to about 200 years
ago
- during this period of little or no
growth all areas of the world had similar standards of
living
- therefore the type of economic
growth that we see now is a recent phenomenon in the history of
the world
- also, the great differences in
living standards is a recent phenomenon in the history of the
world
- How does "modern economic growth"
differ from what came before it?
C. The Uneven Distribution of Growth
1. Modern economic growth has spread only slowly
from its British birthplace. It first advanced to France,
Germany, and other parts of Western Europe in the early 1800's
before spreading to the Untied States, Canada, and Australia by
the mid 1800's.
2. The different starting dates for modern economic
growth in various parts of the world are the main cause of the
vast differences in per capita GDP levels seen today.
3. Figure 8.1 shows what economists have called the
great divergence in income levels around the world as a
result of different rates of, and starting dates for, modern
economic growth.
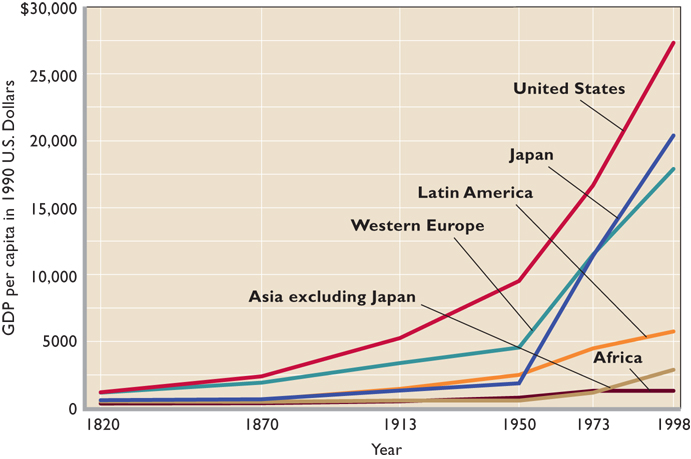
- What is the "great divergence"?
- According to the textbook, what is
the main cause for the "vast differences in in per capita
income levels seen today?
D. Catching Up is Possible
1. Countries that began modern economic growth more
recently are not doomed to be permanently poorer than the
countries that began modern economic growth at an earlier
date.
2. The poorer 'follower countries' can grow much faster
because they can simply adopt existing technologies from rich
'leader countries'.
3. Table 8.2 shows both
- how the growth rates of leader countries are
constrained by the rate of technological progress
- as well as how certain follower countries have been
able to catch up by adopting more advanced technologies and
growing rapidly.
Table 8.2
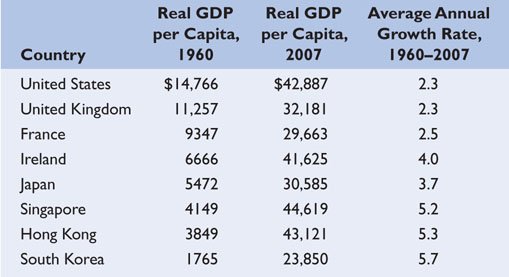
- which countries are the "leader
countries" and which are the "follower countries" in
1960?
- notice that the average growth
rates for the these follower countries is higher than for
the leader countries
- notice that with these growth
rate differences some follower countries have surpassed some
leader countries in real GDP per capita
- According to the authors, why
is the real GDP per capita of the United States in 2007 so
much higher than that of other rich countries?
- larger fraction of
populaiton is working in the US
- longer work weeks in
US
V. Institutional Structures That Promote Growth
A. Table 8.2 demonstrates that poorer follower
countries can catch up. But how does a country start that
process?
B. Economic historians have identified several institutional
features that promote and sustain modern economic growth.
1. Strong Property Rights
2. Patents and copyrights (see the CONSIDER THIS …
Patents and Innovation)
3. Efficient financial institutions
4. Literacy and widespread education
5. Free trade
6. A competitive market system
Note the role of Structural
Adjustment that we studied in unit 1:
- strong property rights -
privatization
- free trade
- a competitive market
system
The textbook lists some other
"difficult-to-measure" factors that help economic
growth:
- stable political
system
- internal order (no civil
wars)
- strong sense of the right of
property ownership
- strong legal status accorded to
businesses
- strong laws to enforce
contracts
- "no social or moral taboos on
production and material progress"
- belief that wealth creation is
a desirable goal
- positive attitude toward
work
- I would add that the more equal
status afforded to women in the leader countries has aided
economic growth
VI. Determinants of Growth - SIX FACTORS from the
textbook
A. Four supply factors relate to the ability to grow.
- INCREASE THE POTENTIAL
1. The quantity and quality of natural
resources,
2. The quantity and quality of human resources,
3. The supply or stock of capital goods, and
4. Technology.
This is the same as:
- more resources
- better
resources
- better
technology
B. Two demand and efficiency factors are also related to
growth - ACHIEVE THE POTENTIAL
1. Aggregate demand must increase for production to
expand.
2. Full employment of resources and productive efficiency
are necessary to get the maximum amount of production
possible.
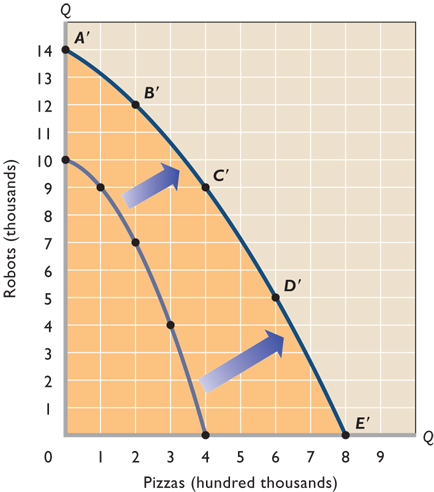
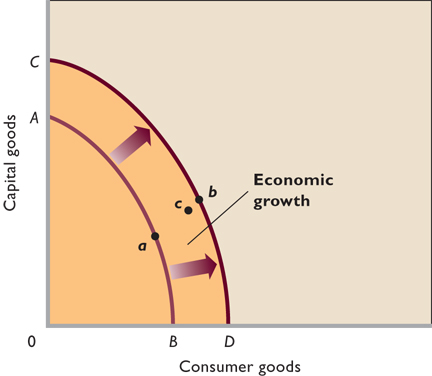
C. Production Possibilities Analysis (Figure 8.2)
1. Supply Factors
shift the production possibilities outward from AB to DC in
Figure 8.2 below
2. After the supply factors shift
the production possibilities the demand and productive
efficiency factors move the economy from a to c or b on the
production possibilities graph in Figure 8.2
below.
Figure 8.2
D. AS-AD Analysis
1. Supply Factors
shift the AS outward from AS to AS in Figure below
2. After the supply factors shift
the production possibilities the demand and productive
efficiency factors increase AD from AS to AD'
1. Aggregate demand must increase to sustain full
employment at each new level of production possible.
E. WE NEED BOTH TYPES OF "ECONOMIC GROWTH" TO MAXIMIZE
SOCIETY'S SATISFACTION
VII. Accounting for Growth
Table 8.3
Average annual percentage changes in the growth of real GDP
in the US and how much was the result of an increase in the
quantity of labor and how much was the result of an increase in
the productivity of labor
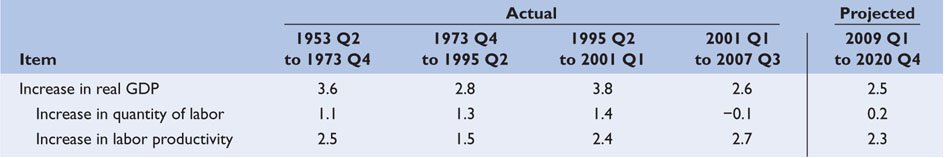
A. More labor input is one source of growth.
- Labor force has grown by 1.7 million workers per year
for the past 52 years
- accounts for about one-third of total economic
growth.
B. The growth of labor productivity
- contributed only about half of the growth from
1973-1993,
- but was responsible for all it from 1995-2004, and
- is expected to account for about three-fourths of the
growth between 2005 and 2011.
C. WHAT CAUSED THE INCREASE IN PRODUCTIVITY
- According to Table 8.3 between half and three quarters
of economic growth in the US during the past 50 -60 year is can
be explained by an increase in the productivity of labor
(output per worker)
- Four causes of an increase in the productivity of
labor:
- 1. Technological advance, the most important factor
in productivity growth, accounts for 40 percent of
productivity growth.
2. Increases in quantity of capital are estimated to
explain about 30 percent of productivity growth.
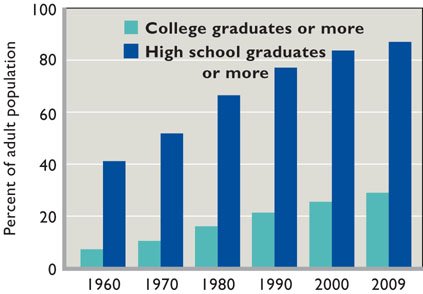
3. Education and training improve the quality of
labor, and account for about 15 percent of productivity
growth. (See Figure 8.4 below)
4. Improved resource allocation and economies of scale
also contribute to growth and explain about 15% of total
productivity growth.
a. Economies of scale occur as the size of markets and
firms that serve them have grown.
See this
Note:
- the quantity of labor does NOT
affect the productivity of labor
- more workers would mean more
production
- but more workers does not
necessarily mean more productivity (more BETTER workers
would increase productivity)
- Know the difference
between:
- production - the quantity
that is produced (the production of cars increased last
month)
- productive efficiency -
producing at the minimum cost (one of the
5Es)
- productivity - how much is
produced per unit of rescues (output per worker per
hour)
- the quantity of labor affects
economic growth and the productivity of labor affects
economic growth, but just because we have more workers
doesn't mean that we have better workers
|
D. CONSIDER THIS … Women, the Labor Force, and
Economic Growth
1. The percentage of women working in the
paid labor force has risen from 40 percent in 1965 to
56 percent in 2006.
2. Women's productivity has increased with
greater investments in human capital. Productivity
increases have raised women's wages and increased the
opportunity cost of staying home.
3. Reduced birthrates, growth in industries
typically attracting women workers, urban migration,
increased availability of part-time jobs, and
antidiscrimination laws have all increased labor
market access for women.
4. in the US during the
recession of 2009 the number of women working
SURPASSED the number of men for the first time
http://www.nytimes.com/2009/02/06/business/worldbusiness/06iht-06women.19978672.html
- How do the
restrictions placed on the role of women in some
countries affect their rate of economic growth and
their living standards?
|
VIII. The Recent Productivity Acceleration
Figure 8.5 Growth of labor productivity in
the US, 1973-2007
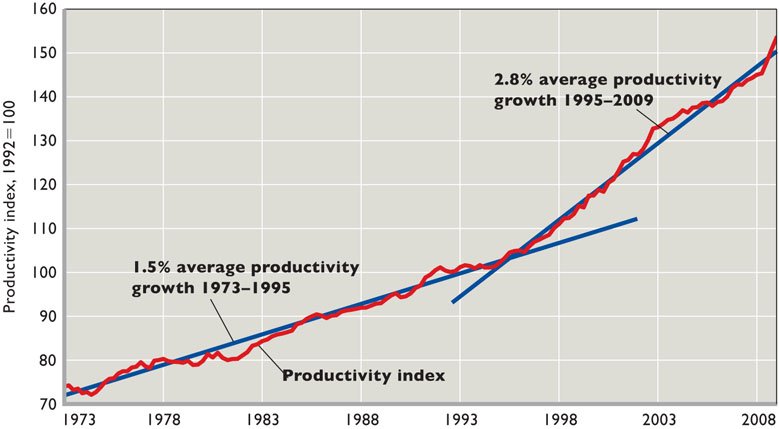
A. Improvement in standard of living is linked to
labor productivity - output per worker per hour
B. The U.S. is experiencing a resurgence of productivity
growth
- based on innovations in computers and
communications
- coupled with global capitalism.
C. Reasons for the Productivity Acceleration since the
mid-1990s:
(Much of the recent improvement in productivity is due to "new
economy" factors)
1. Microchips and information technology
2. New firms and increasing returns characterize the new
economy.
- Some of today's most successful firms didn't exist 25
years ago: Dell, Compaq, Microsoft, Oracle, Cisco Systems,
America Online, Yahoo and Amazon.com are just a few of
many.
3. Economies of scale and increasing returns in new firms
encourage rapid growth
- Economies of scale mean that as business get larger
their average costs of product (cost per unit produced)
decreases. (The long run aver total cost curve [from
microeconomics] is downward sloping
- This means that they can produce each unit of
output with fewer rescues
- Graph showing economies of scale over a wide rage
of output
- Sources of increasing returns and economies of scale
include:
- a. More specialized inputs.
b. Ability to spread development costs over large
output quantities since marginal costs are low.
c. Simultaneous consumption by many
customers at the same time.
d. Network effects make widespread use of
information goods more valuable as more use the
products.
e. Learning increases with practice.
- What is "simultaneous
consumption?
- What are "network
effects"?
- Note that simultaneous
consumption and network effects are relatively recent
phenomena
4. Global competition encourages innovation and
efficiency.
- another recent
phenomenon
D. Even if average growth rates in productivity and real
output growth remain higher over time, business cycle fluctuations
(i.e. recessions) can still occur. (like 2009)
E. Will it continue?
- Skepticism about long-term continued growth
remains
- only time will tell.
IX. Is Growth Desirable and Sustainable?
A. An antigrowth view exists. (Growth is bad)
1. Growth causes pollution, global warming, ozone
depletion, and other problems.
2. "More" is not always better if it means dead-end jobs,
burnout, and alienation from one's job.
3. High growth creates high stress.
B. Others argue in defense of growth. (Growth is
good)
1. Growth leads to an improved standard of
living.
2. Growth helps to reduce poverty in poor
countries.
3. Growth has improved working conditions.
4. Growth allows more leisure and less alienation from
work.
5. Environmental concerns are important, but growth
actually has allowed more sensitivity to environmental concerns
and the ability to deal with them.
C. Is growth sustainable? Yes, say proponents of
growth.
1. Resource prices are not rising.
2. Growth today has more to do with expansion and
application of knowledge and information, so is limited only by
human imagination.\]
Note: what about global climate
change?
X. LAST WORD: Economic Growth in China
A. China has been experiencing a period of remarkable
economic growth.
1. China's real output has grown over the past 25
years at a rate of nearly 9 percent per year, quadrupling real
output over that period.
2. Rising income has led to more saving, greater capital
investment, and more direct foreign investment, which has
helped fuel growth.
3. Per capita income has increased at an annual rate of 8
percent since 1980, despite China's population expanding by 14
million people per year.
4. Increased use of capital, better technology, labor
reallocation from agriculture, and increased privatization have
all contributed to greater productivity.
5. China's growth has been supported by a dramatic
increase in exports ($5 billion in 1978 to $1.2 trillion in
2007).
B. Despite its success, China faces a number of important
problems:
1. Inflation rates have been high at times (15 to
25 percent per year) because of too much spending relative to
capacity. Central banking reform has helped keep inflation low
in recent years.
2. State owned enterprises and banks operate
unprofitably, likely necessitating a government
bailout.
3. China has a poor record of protecting intellectual
property rights, and keeps its currency artificially
undervalued. These issues have caused tension with the United
States and threaten to disrupt trade if they are not
resolved.
4. China's growth and development has been uneven,
meaning that there are many that have not benefited from the
nation's rising incomes.
REVIEW
|
1.
State two (three) definitions of economic growth.
2.
Suppose an economy's real GDP is $50,000 in year 1 and
$55,000 in year 2.
a. What is the growth rate of its GDP?
b.
Assume that population was 100 in year 1 and 105 in
year 2. What is the growth rate in GDP per
capita?
3.
Explain why even small changes in the rate of economic
growth are significant. Use the "rule of 70" to
demonstrate the point.
4.
Which is more important — increasing inputs of
resources or increasing the productivity of those inputs
— as the main source of economic growth in the
United States? Explain.
|
|
ANSWERS:
1.
State two (three) definitions of economic growth.
Economic growth can first be defined and
measured as an increase in real GDP occurring over a
period of time. This could be caused by an increase in
the potential GDP or simply achieving the potential
GDP
Economic
growth can also be defined and measured as an increase
in real GDP per capita occurring over a period of
time. Economic growth is usually calculated as an
annual percentage rate of growth.
2.
Suppose an economy's real GDP is $50,000 in year 1 and
$55,000 in year 2.
a. What is the growth rate of its GDP?
b.
Assume that population was 100 in year 1 and 105 in
year 2. What is the growth rate in GDP per
capita?
a. $5,000/$50,000 or 10% in year 1.
b.
The per capita growth can be calculated as
follows:
- $500 per capita in year 1
($50,000/100);
- $523.81 per capita in year 2
($55,000/105).
- The change is 23.81 compared to base of
$500 or 23.81/500 = 4.77%.
3.
Explain why even small changes in the rate of economic
growth are significant. Use the "rule of 70" to
demonstrate the point.
Small changes in the rate of growth can be
very meaningful, especially for a country where a
fraction of a percent change in the growth rate may
mean the difference between starvation and hunger.
Over a period of time small changes are cumulative in
the same way that compound interest payments are
cumulative on a bank account. Using the rule of 70 to
estimate the time it takes to double GDP, we can see
that a country whose growth rate is 5% takes 14 years
to double its GDP, but a country whose growth rate is
3% may take nearly 10 years longer to double its GDP
or about 23.3 years. If these countries continued to
grow at their respective 5% and 3% rates, in 28 years
the first country's GDP would be quadrupled, whereas
in the second country, it would take nearly 47 years
to quadruple its GDP from the current year.
4.
Which is more important — increasing inputs of
resources or increasing the productivity of those inputs
— as the main source of economic growth in the
United States? Explain.
Both resource quantity and resource
productivity contribute significantly to increased
economic growth in the United States. About a third of
the increase in economic growth comes from increases
in resource input and about two-thirds from increases
in resource productivity. Clearly, it is not the
quantity of resources that is most important but the
quality of resources and how they are used for
production.
|