William Rainey Harper College
ECO 212
Macroeconomics in a Global Economy

Fall 2014

Daily Lessons / Assignments

~/~ Home ~/~ Syllabus ~/~ Schedule ~/~ Lecture Outlines ~/~ Assignments ~/~ Textbook Website ~/~ Online Lectures ~/~ Blackboard ~/~
 STILL UNDER CONSTRUCTION

DAILY SCHEDULE OF ASSIGNMENTS: Click on dates below for the reading assignments, video assignments, outcomes, practice exercises, and key graphs for each lesson or chapter.

August
September
October
November
December

Mon.
Wed.

|

|

|

|

|

|

8/25- 1a

8/27 - 1b

Mon.
Wed.

9/1 No School

9/3 - 1c
- Syllabus Quiz

9/8 - 1d

9/10 - 2a

9/15 - 3a

9/17 - 3b

9/22 - 3c

9/24 - 20a
- Paper 1 due

9/29 - 20b

|

Mon.
Wed.

|

10/1 - 5a

10/6 - 5b

10/8 - Exam 1

10/13 - Unit 2 Introduction

10/15 -12a

10/20- 12b
- last rewrite for paper 1

10/22 - 9a

10/27 - 9b
- Paper 2 due

10/29 - 7a

Mon.
Wed.

11/3 - 8a

11/5 - 22Wa

11/10 Review

11/12 - Exam 2 Study Guide

11/17 - 14a
- last day for paper 2 rewrite

11/19 - 15a
- bring paper 3 article

11/24 - 16a
- Paper 3 due
- Quiz 5

11/26 No School

Mon.
Wed.

12/1 - 10a

12/3 - 13a

12/8 - 13b

12/10 - Exam 3
- last day for paper 3 rewrite

12/15 - Final Exam Study Guide

12/17 - Final Exam Study Guide

|

|


UNIT 1 - INTRODUCTION TO ECONOMICS AND GLOBALIZATION

1a Syllabus and introduction to Economic Globalization

Reading:

  • Buy the textbook

    Macroeconomic by Campbell R. McConnell, Brue, and Flynn, 19th edition, McGraw-Hill, 2012. Just the textbook. No textbook access codes. No "Connect". NOTE: be sure to get the 19th edition even though there is a 20th edition available

  • ISBN: 9780077337728
  • For various inexpensive online sources see TextbookRecycling.com.

Videos:

  • To watch 5 minute video:

    • Click on: http://www.learner.org/resources/series86.html
    • Scroll down to:
      • 10. Developing Countries - How these nations have been helped or hurt by the rapid growth since WWII. Case studies: comparing South Korea and Sri Lanka; aid vs. trade in Tanzania.
    • Click on
    • Then slide the timer to minute 7:45 for the eight minute South Korea vs. Sri Lanka case study

Outcomes / Must Know:

  • Basic math skills
  • How to find class information
  • Define economics.
  • Describe the "economic way of thinking," including definitions of purposeful behavior, utility, opportunity costs, marginal costs, marginal benefits and how these concepts may be used in decision-making.
  • Explain how economists use the scientific method to formulate economic principles.
  • Explain the importance of ceteris paribus in formulating economic principles.
  • Explain the steps used by policy makers.
  • Differentiate between micro- and macroeconomics.
  • Explain and illustrate a direct relationship between two variables, and define and identify a positive sloping curve. (Appendix)
  • Explain and illustrate an inverse relationship between two variables, and define and identify a negative slope. (Appendix)
  • Identify independent and dependent variables. (Appendix)
  • Define and identify terms and concepts listed at end of chapter and appendix.


Practice:

  • Check the Yellow Pages
  • Online Review Quizzes
  • Study Guide:
    •  Appendix to Chapter 1:
      • Multiple Choice: # 1, 2, 6, 11, 12 15, 16, 17
      • Problems: # 1a, 1b, 2a, 4


Extra Videos


1b The 5Es

The "5Es of Economics" are not from the textbook. I borrowed the concept (with many modifications) from another textbook many years ago. I believe it concisely explains the purpose of economics. Also, it begins to introduce students to the economic way of thinking. The economic problem that we all face, that all countries face, that the world faces, is SCARCITY. Economics is the study of how we can reduce scarcity. What I like about the 5Es model is that it shows us that there are only five ways to reduce scarcity. Only five. Simple.

For each of the 5Es (1) learn the defininition, (2) understand examples, and most importantly, (3) know how they reduce scarcity and help to maximize society's satisfaction.

This is where you learn that it may be good when the price of plywood increases greatly during a hurricane. And it might be good when Coca-Cola lays of one fifth of its workforce. Or, that the price of gasoline may be too low. Really.

Reading:

  • Syllabus
  • The 5Es of Economics (VERY IMPORTANT!)
  • Ch. 3: "Efficient Allocation" pp. 58-59
  • Ch. 3 and 6: "Diminishing Marginal Utility" pp. 49 and 117
  • Ch.1, Appendix on Graphing

Videos:

Outcomes / Must Know:

  • Define economics.
  • Describe the "economic way of thinking," including definitions of purposeful behavior, utility, opportunity costs, marginal costs, marginal benefits and how these concepts may be used in decision-making.
  • Explain how economists use the scientific method to formulate economic principles.
  • Explain the importance of ceteris paribus in formulating economic principles.
  • Explain the steps used by policy makers.
  • Differentiate between micro- and macroeconomics.
  • Differentiate between positive and normative economics.
  • Explain the economizing problem from the individual's perspective
  • Construct and explain a budget line.
  • Describe the economizing problem facing society.
  • Identify types of economic resources and types of income associated with various factors.
  • Construct a production possibilities curve when given appropriate data.
  • Illustrate economic growth, unemployment and underemployment of resources, and increasing costs using a production possibilities curve.
  • Give some real-world applications of the production possibilities concept.
  • Summarize the general relationship between investment and economic growth.

Practice:


1c Scarcity and Budget Lines

So, do you agree that it is GOOD for the people of Florida if, after a hurricane strikes, the price of plywood (or other products) increases from $10 a sheet to $30 a sheet? Or, that it was GOOD when the Coca-Cola company (or other companies) layed off 6000 workers as they did in the year 2000 assuming that they could still produce the same quantity, but with fewer workers? Even if you do not agree, do you understand that these things will reduce scarcity and increase society's satisfaction? In chapter five we will learn why the price of gasoline, soda pop, and junk food, may be TOO LOW. (Isn't this fun?)

Lesson 1c introduces our first graphic MODEL: the budget line. For many students microeconomics is a difficult course. I think there are two reasons for this. First, we will learn therories or models, rather than facts. Facts are easy to memorize. Theories or models have to be learned and practiced. And second, we will express our theories or models on graphs, and many studetns do not like graphs. If you want to be successful you must learn to use our graphical models. You must be able to draw the graphs correctly from memory, you must understand what each line on the graph represents, and you must know why each line has the shape that it does: DEFINE, DRAW, DESCRIBE SHAPE. Study the graphs in the textbook carefully and plot all the graphs in the yellow pages. Finally, remember this: each point on a graph represents two numbers. It is that easy. Find a point on a graph, then find the two number from the graph's axes.

Reading:

  • Ch 1, pp.1-11
  • Budget Lines: pp. 7-10

Videos:

Outcomes / Must Know:

  • Define economics.
  • Describe the "economic way of thinking," including definitions of purposeful behavior, utility, opportunity costs, marginal costs, marginal benefits and how these concepts may be used in decision-making.
  • Explain how economists use the scientific method to formulate economic principles.
  • Explain the importance of ceteris paribus in formulating economic principles.
  • Explain the steps used by policy makers.
  • Differentiate between micro- and macroeconomics.
  • Differentiate between positive and normative economics.
  • Explain the economizing problem from the individual's perspective
  • Construct and explain a budget line.
  • Summarize the general relationship between investment and economic growth.

Practice:

Extra Videos


1d Production Possibilities Curve (PPC) and Benefit Cost Analysis (BCA)

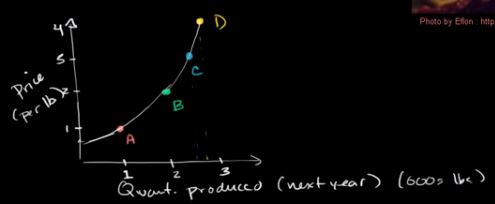
Here we will study our second graphical model: the PPC, and we then will learn a tool for making decisions that we will use throughout the course: BCA. Basically what we are doing is setting the stage for making economic decisions. Remember: economics is the social science concerned with how we choose to use our limited resources to maximize society's unlimited wants, or, how we make decisions.

The production possibilities curve will show us that all decisions have costs. Economists call these "opportunity costs". ALL COSTS IN ECONOMICS ARE OPPORTUNITY COSTS. Whenever we discuss the "costs" of doing something we will mean the complete opportunity cost.

Benefit cost analysis is simple: to make the best decision we should select all options where the marginal benefits (MB) are greater than the marginal costs (MC) -- up to where MB = MC. When the MB = MC then we have made the best decision possible. NOTE: "marginal" means "extra" or "additional". So to make the best decision possible select all options where the extra benefits that you get from the decision are greater than the extra costs of the decision. One more thing: to make the best decisions we look only at MARGINAL costs and benefits and we ignore FIXED, or SUNK, costs.

Notice that economists look at EXTRA benefits and EXTRA costs. We call this "thinking on the margin". Students are used to thinking about TOTAL benefits and TOTAL costs. We do not want total benefits to equal total costs, but we do want MB to equal MC. You probably know that it is best if the total benefits are a lot higher than total costs. What you will learn is that when MB = MC, then the difference between total benefits and total costs will be the greatest.

What is the connection between the PPC and BCA? Well, when studying the PPC you will learn the important concept of "opportunity cost". Learn the definition well. Since all costs in economics are opportunity costs, then when using BCA, "marginal costs" mean the additional opportunity costs.

Reading:

  • PPC: pp. 11-14

Videos:

Outcomes / Must Know:

  • Describe the economizing problem facing society.
  • Identify types of economic resources and types of income associated with various factors.
  • Construct a production possibilities curve when given appropriate data.
  • Illustrate economic growth, unemployment and underemployment of resources, and increasing costs using a production possibilities curve.
  • Give some real-world applications of the production possibilities concept.
  • Summarize the general relationship between investment and economic growth.
  • Benefit Cost Analysis

Practice:

Extra


2a Globalization (Structural Adjustment)

Reading:

  • Cuba Examines Asian Model For Economic Reforms (NPR Morning Edition)
  • Textbook:
    • Chapter 2 ALL
    • PLUS
      • Ch. 2 Last Word: "Shuffling the Deck": p. 42
      • Ch. 8 The Last Word - "Economic Growth in China": p. 166
      • Ch. 8 Global Competition, p. 164
      • Ch. 20 The Last Word - "Petition of the Candlemakers, 1845": p. 419
      • http://www.harpercollege.edu/mhealy/eco212i/lectures/command/econsys.htm
      • Chapter 23W of the 16th edition of our textbook, pages 2-13, found on our Blackboard site
        • State Ownership and Central Planning: pp. 23W-2 to 23W-3
        • Problems with Central Planning pp. 23W-3 to 23W-5
        • The Collapse of the Soviet Economy pp. 23W-5 to 23W-6
        • The Russian Transition to a Market System pp. 23W-6 to 23W-9
        • Market Reforms in China pp. 23W-10 to 23W-11
        • Outcome and Prospects pp. 23W-11 to 23W-13
        • Conclusion pp. 23W-13

Videos:

Outcomes / Must Know:

  • Highlight the main features of a market economy and a command economy.
  • List and explain the important characteristics of the American market system.
  • State the Five Fundamental Questions faced by any economic system.
  • Describe how the market system answers each of these five fundamental questions.
  • Explain how the consumer influences the "What goods and services will be produced?" question.
  • Explain how a market system achieves economic efficiency.
  • Explain how markets answer the "Who will get the output?" question.
  • Describe how prices drive the movement of resources in a market system.
  • Describe how the market system promotes technological improvements and capital accumulation.
  • Explain the role of self-interest and "invisible hand" in promoting economic efficiency.
  • Explain why the command systems of the Soviet Union, Eastern Europe, and China failed.
  • Identify the decision makers and the markets in a market system using the circular flow diagram.
  • Identify the two roles each that households and businesses play using the circular flow diagram.
  • Differentiate between product and resource markets.
  • Define and identify terms and concepts listed at the end of the chapter.

Practice:

Extra Videos


3a Demand

If the price of pizza goes up, what happens to the demand for pizza? NOTHING happens to the demand for pizza if the price changes!

The next three modules introduce the demand and supply model for explaining how prices arise and change in a market economy. Learn these modules well. Do the assigned problems. Draw the graphs in the yellow pages and while you are reading and studying. DRAW GRAPHS! Get used to using the graphs to help you answer questions. If you are avoiding drawing the graphs you will do poorly and not get the practice that you need to learn the concept.

So why doesn't the demand for pizza change if the price changes? Because economists have a different definition of "demand". Demand is NOT the quantity that we buy. If the price of pizza goes up we will buy less, but that is not what "demand" means in economics. Economists tend to be precise with their definitions and sometimes their definitions are different than the more commonly used definitions. Things like "scarcity", "investment", "cost", "demand", and "supply", have different definitions in economics than what you may already know. Learn our definitions! Demand is not how much we buy. Demand has a different definition in economics. "Demand" means the "demand graph".

Remember, that econmists use models (like the supply and demand model) to simplify the real world. They do this by isolating certain variables from all the clutter found in reality. Then by changing one variable at a time economists can see what effect it will have. In this module we will learn the economic definition of DEMAND and plot the demand graph. Then, we will look at one variable at a time to see what effect they have on the demand curve.. We call these variables the "non-price determinants of demand". They are: Pe, Pog, I, Npot, T. LEARN THEM! LEARN THEM WELL! Know how each one effects the demand curve. Be sure to do the yellow pages. If you will not learn how the non-price determinants of demand affect the demand curve you may as well drop the course now. Do the Yellow Pages and other Practice Activities until you understand the concept well.

Reading:

Videos:

  • EC The Law of Demand – HD (6:18)
  • EC The Determinants of Demand (10:25)
  •  
  •  


    AC Demand and Supply Explained 1 of 2 (6:42)

    AC Demand and Supply Explained 2 of 2 (4:56)

    AC Micro 2.1 Supply and Demand Curves- Basic Economic Concepts (4:42)

    AC Micro 2.2 Supply and Demand (Economics) (2:01)

    AC Micro 2.3 Shifting Supply and Demand: Econ Concepts in 60 Seconds Practice (2:50)

    AC Micro 2.4 Double Shifts in Supply and Demand: Econ Concepts in 60 Seconds (2:33)

    EconMovies: Episode 4: Indiana Jones (Demand, Supply, Equilibrium, Shifts) (7:02)


Outcomes / Must Know:

  • Explain who and what demand represents.
  • Differentiate between demand and quantity demanded.
  • Graph demand curves when given demand schedules.
  • State the Law of Demand, and explain why price and quantity demanded are inversely related.
  • List the major determinants of demand, and explain how a change in each will affect the demand curve.
  • If the price of pizza increases why does the demand for pizza not change?
  • What are Pe, Pog, I, Npot, T (PPINT)?
  • What is that Campbell's Pork and Beans can doing on the display for VanCamp's Pork and Beans?

  • Define and identify terms and concepts listed at the end of the chapter.


Practice:

Extra Videos

  • Introduction to economics
  • Law of demand
  • Change in expected future prices and demand
  • Price of related products and demand
  • Changes in income, population, or preferences
  • Normal and inferior goods
  • Inferior goods clarification
  • Law of supply
  • Factors affecting supply
  • Long term supply curve
  • Market equilibrium
  • Changes in market equilibrium
  • Breakdown of gas prices
  • Short-run oil prices


3b Supply

If the price of pizza goes up what happens to the SUPPLY of pizza? NOTHING! A change in the price of a product does not affect its supply, or its demand. When the price goes up the QUANTITY SUPPLIED will increase, but the supply does not change. Learn the difference between "supply" and "quantity supplied". "Supply" does NOT MEAN the quantity available for sale. Supply has a different definition in economics. "Supply" means the "Supply graph".

So what would cause the supply graph, or supply itself. to change? Those things that cause supply to change are called the "non-price determinants of supply". They are: Pe, POG, Pres, Tech, Tax, Nprod. See the Yellow Pages.

Remember, the goal of chapter 3 is to learn a model that will haelp us understand why prices are what they are and why they change. In the next lesson we will put demand and supply together and use the model (graph) to find the prices of products. Then, and more importantly, we will see ehat causes prices to change. If you hear on the.news or read in your news ap that the price of gasoline is going down, we will be able to explain WHY. The causes of changes in prices of products are the five non-price determinants of demand (Pe, Pog, I, Npot, T) and/or the six non-price determinants of supply (Pe, POG, Pres, Tech, Tax, Nprod.). Whenever you hear that the price of something is changing think of these 11 possible causes.

Reading:

  • Ch3, pp. 53-56

Videos:

Outcomes / Must Know:

  • Explain who and what supply represents
  • Differentiate between supply and quantity supplied.
  • Graph supply curves when given supply schedules.
  • State the Law of Supply, and explain why price and quantity supplied are directly related.
  • List the major determinants of supply, and explain how a change in each will affect the supply curve.
  • Define and identify terms and concepts listed at the end of the chapter.

Practice:

Extra Videos


 3c Market Equilibrium: So, what happens to Price and Quantity? AND Efficiency

We are going to learn two very important things in this lesson.

First, we will put demand and supply together and learn how to use the model to to see why products have the prices that they do and why those prices change. We will put demand and supply together and use the model (graph) to find the prices of products. Then, and more importantly, we will see what causes prices to change. If you hear on the news or read in your news app that the price of gasoline is going down, we will be able to explain WHY. The causes of changes in prices of products are the five non-price determinants of demand (Pe, Pog, I, Npot, T) and/or the six non-price determinants of supply (Pe, Pog, Pres, Tech, Tax, Nprod.). Whenever you hear that the price of something is changing think of which of these 11 possible causes have changed, draw the graph and shift the appropriate demand and/or supply graph, and the graph will show the price changing.

Second, we learn that in a competitive market economy the interaction of demand and supply will determine what the prices of products will be and how much people will buy at that price. Then, we will ask: Is this the allocatively efficient quantity and price? Our goal is to show that in a competitive market the price will change until allocative efficiency is achieved. In chapter 2 we learned that markets are efficient. That they will produce the quantity of goods that maximizes the society's satisfaction. Here will will show the allocativley efficient price and quantity on a graph. Competitive markets are efficient.

Reading:

Videos:


Outcomes / Must Know:

  • Explain the concept of equilibrium price and quantity.
  • Illustrate graphically equilibrium price and quantity.
  • Explain the rationing function of prices.
  • Define productive and allocative efficiency, and explain how competitive markets achieve them.
  • Explain and graph the effects of changes in demand and supply on equilibrium price and quantity, including simultaneous changes in demand and supply.
  • Define and identify terms and concepts listed at the end of the chapter.
  • Define, measure, and graphically identify consumer surplus.
  • Define, measure, and graphically identify producer surplus.
  • Identify and explain efficiency (or deadweight loss) using consumer and producer surplus.
  • Explain how equilibrium achieves both productive and allocative efficiency.

Practice:

Extra Videos


20a Why we Trade: Comparative Advantage

Reading:

Videos:

Outcomes / Must Know:

  • State two economic points that explain why nations trade.
  • Compute, when given appropriate data, the relative costs of producing two commodities in two countries and determine which nation has the comparative advantage in each good.
  • Compute, when given appropriate data, the range for the terms of trade.
  • Calculate the potential gains from trade and specialization for each nation and the world when given appropriate data.
  • State the economist's case for free trade.
  • Explain the relationship between world prices and American export supply curve, and the relationship between world prices and American import demand curve.
  • Explain international equilibrium price and quantity using a two-nation market model for import demand and export supply.

Practice:

Extra Videos

20b International Trade and Foreign Exchange Markets

Reading:

  • Flexible Exchange Rates pp. 429-430;
  • Recent U.S. Trade Deficits pp.438-439

Videos:

Outcomes / Must Know:

  • Summarize the importance of international trade to the U.S. in terms of overall volume.
  • List the major imports and exports of the United States.
  • Identify four types of trade barriers.
  • Describe the economic impact of tariffs, including both direct and indirect effects.
  • Contrast the economic impact of a quota with that of a tariff.
  • List seven arguments in favor of protectionist barriers, and critically evaluate each.
  • Identify the costs of protectionist policies and their effects on income distribution.
  • Describe the major provisions of the WTO, and explain why some protest against the WTO.
  • Explain how trade adjustment assistance is used to mitigate harmful effects of world trade.
  • Define and identify terms and concepts listed at the end of the chapter.


Practice:

Extra Videos


5a Role of Gov't and Market Failure: Negative Externalities

In lesson 3c we learned that competitive markets are efficient and we learned two models to show that markets are efficient: (1) MSB = MSC, and (2) maximum consumer plus producer surplus. You must understand these models to understand chapter 5. In chapter 5 we learn that SOMETIMES markets are NOT efficient.

When are product markets not efficient?

  1. when the government sets the price (price ceilings and price floors - lesson 5a, chapter 3)
  2. when the supply curve does not include all of the costs of producing or consuming the product (negative externalities - lesson 5a, chapter 5)
  3. when the demand curve does not include all of the benefits of consumption (positive externalities - lesson 5b, chapter 5)
  4. when the products are "public goods" (lesson 5b, chapter 5).
  5. when there is not competition (monopolies and oligopolies - chapters 10 and 11)

In this lesson we also will begin our look at the role of the government in a market economy. This would be a good time to review chapter 2. In chapter 2 we learned that there is a limited role for government in market economies. We learned in lesson 3c that markets are efficient, so there is little need for the government. In this lesson we will see what happens if the government interferes in markets. We will learn that sometimes governments will set prices (price ceilings and price floors), rather than letting the market set the price. In other words: SOMETIMES GOVERNMENTS CAUSE ALLOCATIVE INEFFICIENCY. (This is the plywood after a hurricane example discussed in the 5Es reading.)

Then we will begin to look at examples of when the markets on their own fail to achieve allocative efficiency and examine what the government can do to correct these market failures. SOMETIMES MARKETS BY THEMSELVES ARE INEFFICIENT and the government may try to modify the market to help it achieve allocative efficiency. There are three MARKET FAILURES that we will look at in chapter 5. A "market failure" occurs when the market fails to achieve allocative efficiency. In lesson 5a we look at the market failure cause by negative externalities - when the supply curve does not include all of the costs to society of producing and consuming the product. Then in lesson 5b we look at the market failures of positive externalities and public goods.

We will assume that businesses will always produce the profit maximizing quanitity since that is their goal - to maximize profits. The profit maximizing quantity is also the equilibrium quantity that we studied in chapter 3, when the Qs = Qd. This is WHAT WE GET. We get whatever they produce and they will produce the quantity that gives them the biggest profits. The goal of business is not to be efficient. Their goal is to maximize their profits. If a business can make larger profits by being inefficient then they will be inefficient. Or if they can make larger profits by being efficient they they will be efficient. The main point is that efficiency is not their goal, rather maximizing profits is their goal.

The allocatively efficient quantity is what society wants. We learned at the end of chapter 3 that allocative efficiency occurs at the quantity where MSB = MSC. This is WHAT WE WANT. We want to maximize our satisfaction and we learned in chapter one that this occurs when we achieve the 5 Es. Allocative efficiency is one of the 5 Es.

When the profit maximizing quantity equals the allocatively efficient quantity then markets are efficient . This means that profit maximizing businesses are producing the quantity that maximizes society"s satisfaction. WHAT WE GET = WHAT WE WANT. This is the INVISIBLE HAND of capitalism that was discussed in chapter 2. It's as if there is an invisible hand guiding businesses to not only make decisions that maximize profits, but also to maximize society's satisfaction. As if they don't even know it is happening.

When markets fail to achieve allocative efficiency, the profit maximizing quantity (WHAT WE GET or the equilibrium quantity from chapter 3) is not the same as the allocatively efficient quantity (WHAT WE WANT or the quantity where MSB=MSC). Since one of the economic goals of government is to help the economy achieve efficiency, governments often get involved to correct for market failures. If the market produces too much (negative externalities; allocative inefficiency; overallocation of resources) the government tries to get it to produce less. If the market produces too little (positive externalities and public goods; allocative inefficiency; underallocation of resources) the government tries to get it to produce more.

Reading:

Videos:

Outcomes / Must Know:

  • Define price ceilings and price floors, and provide examples.
  • Graph and explain the consequences of government-set prices.
  • Explain what is meant by externalities.
  • Describe graphically and verbally how an over allocation of resources results when negative externalities costs are present and how this can be corrected by government action.
  • Describe government policies that would reduce negative externalities.
  • Analyze government's role in the economy and government's inefficiencies.
  • Define and identify terms and concepts listed at the end of the chapter.

Practice:

5b Market Failures (Positive Externalities and Public goods) and Government Finance

We have learned that competitive markets are usually efficient. This is one of the benefits of a market economy or capitalism (chaprter 2) . But sometimes even markets can be allocatively inefficient. In lesson 5a we learned that when negative externalities exist, a market will produce too much of a good or service (an overallocation of resources) and therefore the government should tax the product (like gasoline taxes) to get consumers to buy less, i.e. without the tax the price of gasoline is too low.

In this lesson we will look at two other market failures, but this time the market produces too little (and underallocation of resources) because the demand curve for the product does not include all of the benefits. This occurs when there are positive externalities and when there are "public goods" Be careful - remember - economists often change the definitions of words. A public school or a public park are not public goods according to our definition. Since markets produce too little when there are negative externalities or public goods, the goal of government is to increase production.

In microeconomics we discuss another market failure: the lack of competition. If a market is not competitive, like when it is a monopoly, then profit maximizing businesses will produce less than the efficient amount. The invisible hand of capitalism does not work well if the market is not competitive.

Reading:

  • Chapter 5: Public Goods; Externalities; Government’s Role in the Economy pp. 99-110

Videos:

Outcomes / Must Know:

  • Distinguish between demand-side and supply-side market failures and the kinds of externalities that are created by each.
  • Explain what is meant by externalities.
  • Describe graphically and verbally how an under allocation of resources occurs when positive externalities are present and how this can be corrected by government action.
  • Analyze government's role in the economy and government's inefficiencies.
  • Identify the characteristics of public goods and explain how they differ from private goods.
  • Describe graphically the collective demand curve for a particular public good and explain this curve.
  • Explain why the supply curve for public goods is upward sloping and explain how the optimal quantity of a public good is determined.
  • Identify the purpose of cost-benefit analysis and explain the major difficulty in applying this analysis.
  • Define and identify terms and concepts listed at the end of the chapter.


Practice:


UNIT 2 - INTRODUCTION TO MACROECONOMICS

12a - The AD/AS Model: The Graph

Reading:

  • Chapter 12 - Aggregate Supply and Aggregate Demand
    • Chapter 12 ALL (not the appendix)
    • PLUS:
      • Ch. 9: The Business Cycle: pp. 171-173
      • Ch. 13: Fiscal Policy and the AD-AS Model: pp. 258-261
      • Ch. 18: Taxation and AS (Supply -Side Economics): pp. 374-378
      • Ch. 18: From Short Run to Long Run / Applying the Extended AS-AS Model - pp. 362-368
      • Ch. 9: Types of Inflation: pp. 179-180
  • Ch. 6 Reading Assignments:
    • Chapter 6 ALL
    • PLUS:
      • Review Ch. 9: The Business Cycle: pp. 171-173
  • Review Ch. 1: "Present Choices, Future Possibilities": pp. 16-18

Videos:

Outcomes / Must Know:

  • Explain what is meant by a business cycle, name its four phases, and explain what happens to UN, IN, and EG in each.
  • Define aggregate demand and aggregate supply.
  • Give three reasons why the aggregate demand curve slopes downward.
  • State the determinants of the aggregate demand curve's location, and explain how the curve will shift when each of these determinants changes.
  • Explain the shape of the short-run aggregate supply curve (Keynesian, Intermediate, and Classical ranges) Be sure to explain WHY each has the shape (slope) that it does.
  • Indicate the determinants of the aggregate supply curve's location, and explain how the curve will shift when each of those determinants changes.
  • Define and identify terms and concepts at the end of the chapter.


Practice:

Chapter 12

Chapter 6

  • Reading Assignments:
    • Chapter 6 ALL
    • PLUS:
      • Review Ch. 9: The Business Cycle: pp. 171-173
      • Review Ch. 1: "Present Choices, Future Possibilities": pp. 16-18
  • Study Guide – Chapter 6
    • Multiple Choice: 1-5, 7-10, 13-15, 22, 25
    • Problems: 2, 3
  • Web Quiz: Chapter 6 # 2-10 at http://highered.mcgraw-hill.com/sites/0077337727/student_view0/chapter6/quiz.html
  • End-of-Chapter Questions and Problems:
    • Questions # 1, 4, 5, 6
    • Problems # 3, 5

Key Graph:


Extra Videos


12b - TheAD/AS Model: Equilibrium and Policy

Reading:

  • Chapter 12 - Aggregate Supply and Aggregate Demand
    • Chapter 12 ALL (not the appendix)
    • PLUS:
      • Ch. 9: The Business Cycle: pp. 171-173
      • Ch. 13: Fiscal Policy and the AD-AS Model: pp. 258-261
      • Ch. 18: Taxation and AS (Supply -Side Economics): pp. 374-378
      • Ch. 18: From Short Run to Long Run / Applying the Extended AS-AS Model - pp. 362-368
      • Ch. 9: Types of Inflation: pp. 179-180
  • Ch. 6 Reading Assignments:
    • Chapter 6 ALL
    • PLUS:
      • Review Ch. 9: The Business Cycle: pp. 171-173
  • Review Ch. 1: "Present Choices, Future Possibilities": pp. 16-18

Videos:

Outcomes / Must Know:

  • Find an economy's equilibrium price level and real domestic output using AD/ASgraph
  • Demonstrate and explain the effects of shifts in aggregate demand on the equilibrium price level and inflation and on the real domestic output of an economy and unemloyment and economic growth
  • Explain using an AD/AS graph what happens to RDOm the price level, UE, IN, and EG when there is a change in AD and/or AS.
  • Explain the ratchet effect and demand pull inflation
  • Explain cost-push inflation and stagflation
  • Explain long run adjustments to changes in AD and why the long-run aggregate supply curve is a vertical line (LRAS).
  • Explain how the impact of oil price fluctuations has changed for the U.S. economy over the past couple decades
  • Define the following policies: stabilization, demand management, fiscal, monetary, and supply-side
  • Differentiate between expansionary and contractionary fiscal policy and recognize the conditions on an AD/AS graph for recommending an expansionary or contractionary policy.
  • Differentiate between easy (expansionary) and tight (contractionary) monetary policy and recognize the conditions on an AD/AS graph for recommending an expansionary or contractionary policy.
  • Know how a change in the money supply is transmitted to a change in AD [MS interest rates I AD]
  • Use the AD/AS model (graph) to explain the economic history of the United States in the past hundred years.
  • Define supply-side economic policy, illustrate its on the AD/AS model, and explain its policies including decreasing marginal tax rates.
  • What is the Laffer Curve?
  • Define and identify terms and concepts at the end of the chapter and in the appendix.

Practice:

Key Graphs:

Extra Videos


9a UE

Reading:

  • Chapter 9: ALL
  • Ch. 7: "GDP Price Index," pp. 141-142

Videos:

Outcomes / Must Know:

  • What is unemployment? Describe how unemployment is measured. How is the unemployment rate calculated? Who is included as employed, unemployed, and who is not in the labor force?
  • Why might UE increase as an economy is beginning to recover?
  • Define the "Real Rate of UE".
  • What is full employment? Identify the full employment, or natural rate, of unemployment and explain why 5% unemploymnent can be called full employment.
  • Define and give examples of frictional, cyclical, and structural unemployment.
  • How and why has the natural rate of unemployment changed over the past five or six decades?
  • Identify the economic costs of unemployment and the groups that bear unusually heavy unemployment burdens.
  • What is a positive GDO gap and a negative GDP gap?
  • Define and identify terms and concepts at the end of the chapter.

Practice:

Extra Videos


9b IN

Reading:

  • Chapter 9: ALL
  • Ch. 7: "GDP Price Index," pp. 141-142

Videos:

Outcomes / Must Know:

  • Define inflation and deflation
  • Calculate the inflation rate using price index data
  • What is a price index and how is the CPI measured?
  • Explain the two types of inflation (demand-pull; cost-push) using the AD/AS graph
  • What is the rule of 70 and apply it to the price level.
  • List three groups who are hurt and two groups who may benefit from unanticipated inflation.
  • Present the effects of inflation on output, employment, and the redistribution of income (who is hurt and who is helped?)
  • How does the inflation rate affext real income growth?
  • Define and identify terms and concepts at the end of the chapter.


Practice:

Extra Videos


7a GDP

Reading:

  • Chapter 7 - ALL 

Videos:

Outcomes / Must Know:

  • Use a circular flow diagram to show the two ways of calculating GDP
  • Define and calculate GDP and NI when given national income data.
  • Define and give examples of final goods, intermediate goods, and double counting.
  • Differentiate between gross and net investment and explain the relationship between net investment and economic growth.
  • Define Investments and state what is included. Explain why changes in inventories are investments.
  • Calculate net investment and explain how it indicates a growing, static, or declining economy.
  • Explain why imports are subtracted to calculate GDP
  • List the shortcomings of GDP as an index of social welfare.
  • Find real GDP by adjusting nominal GDP with use of a price index and be able to find the years of recessions given nominal GDP data.
  • Define and identify terms and concepts listed at the end of the chapter.
  • Required Formulas:
    • GDP = C + Ig + G + Xn
    • NI = wages + rents + interest + corporate profits + proprietor's income
    • NDP = C + In + G + Xn
    • NDP = GDP - depreciation
    • In = Ig - depreciation
    • Xn = X - M
    • real GDP = (nominal GDP / price index) x 100

Practice:


Extra Videos:


8a Economic Growth (EG)

Reading:

Videos:

Outcomes / Must Know:

  • Give three definitions of economic growth and illustrate them on the 5Es, PPC, AS/AD, and LRAS models.
  • Use the 5Es, PPC, AS/AD, and LRAS models to differenciate between "achieving our potential" and "increasing our potential".
  • Explain why growth is a desirable goal.
  • Define “modern economic growth” , "great divergence", "leading country", and "follower country".
  • Identify two main sources of growth and apply them to the growth history of the United States.
  • Explain and apply the "rule of 70."
  • Identify the general supply, demand, and efficiency forces that give rise to economic growth.
  • Differentiate between production, productive efficiency, and productivity
  • What are the determinants of productivity growth?
    • If the quantity of labor increases, what happens to productivity? ANSWER: Nothing. The quantity of labor will affect production, but the quality of labor affects productivity
  • Identify and explain the arguments for and against economic growth.
  • Define and identify terms and concepts at the end of the chapter.

Practice:

Key Graphs and Figures:


Extra Videos:


22Wa LDCs

Reading:

Videos:

Outcomes / Must Know:

  • Identify various terms that are used to name the rich and poor countries, including the "global south" and have a generao understanding of where thay are on a world map.
  • Where to most of the world's people live?
  • Describe the world distribution of wealth
  • What is the "vicious cycle" and how does population growth affect it?
  • Identify the characteristics of DVCs.
  • How does population growth affect the growth in GDP per capita?
  • Define and give examples of the primary, secondary, and tertiary sectors of an economy
  • List some of the obstacles to economic development.
  • Explain the vicious circle of poverty that afflicts low-income nations.
  • Discuss the role of the DVC government in promoting economic development within their country
  • Describe how IACs can help low-income countries including the trade vs. aid debate
  • How can agricultural subsidies in the IACs (MDCs) negativley affect economic growth in the DVCs (LDCs)?
  • Describe the growth rates of IACs and DVCs and the growing absolute income gap between rich and poor countries.
  • Define and identify terms and concepts listed at the end of the chapter

Practice:


UNIT 3 - MACROECONOMIC POLICY

14a Money, The Money Market Model, and the Fed

Reading:

Videos:

Outcomes / Must Know:

  • Why is money important?
  • List and explain the three functions of money.
  • State three reasons why currency and checkable deposits are money and why they have value.
  • Define the money supply M1 and near monies M2.
  • Identify two types of demand for money and the main determinant of each.
  • The money market graph: explain what is meant by equilibrium in the money market and the equilibrium rate of interest; what happens when there is a change in the money supply?
  • Describe the structure of the U.S. banking system.
  • Explain why Federal Reserve Banks are central banks, quasi public banks, and bankers' banks.
  • Describe seven functions of the Federal Reserve System and point out which role is the most important.
  • Define and identify terms and concepts listed at the end of the chapter.

Practice:

KEY GRAPHS

Money Demand

Increase in the money supply

Decrease in the money supply

Investment Demand

Extra Videos:


15a How Banks Create Money

Reading:

  • Chapter 15: ALL 

Videos:

Outcomes / Must Know:

  • Recount the story of how fractional reserves began with goldsmiths.
  • Explain the effects of a currency deposit in a checking account on the composition and size of the money supply.
  • Compute a bank's required and excess reserves when you are given its balance sheet figures.
  • Explain why a commercial bank is required to maintain a reserve and why it isn't sufficient to cover deposits.
  • Describe what happens to the money supply when a commercial bank makes a loan or buys securities.
  • Describe what happens to the money supply when a loan is repaid or a bank sells its securities.
  • Explain what happens to a commercial bank's reserves and checkable deposits after it has made a loan.
  • Describe how a check drawn on one commercial bank and deposited in another will affect the reserves and excess reserves in each bank after the check clears.
  • Describe what would happen to a single bank's reserves if it made loans that exceeded its excess reserves.
  • Explain how it is possible for the banking system to create an amount of money that is a multiple of its excess reserves when no single bank ever creates money greater than its excess reserves.
  • Compute the size of the monetary multiplier and the money creating potential of the banking system when provided with appropriate data.
  • Explain that the money multiplier process can also lead to multiple destruction of money.
  • Define and identify the terms and concepts at the end of the chapter.

Practice:

Extra Videos:


16a Monetary Policy

Reading:

  • Chapter 16 ALL


Videos:

Outcomes / Must Know:

  • Identify the goals of monetary policy.
  • List the principal assets and liabilities of the Federal Reserve Banks.
  • Explain how each of the three tools of monetary policy may be used by the Fed to expand and to contract the money supply.
  • Explain the relative importance of the monetary policy tools.
  • Describe how the Fed targets the Federal funds rate as part of its OMO monetary policy actions.
  • Describe expansionary and restrictive monetary policies, and explain why and how they are used.
  • Explain the cause effect chain between monetary policy and changes in equilibrium GDP.
    • Demonstrate graphically the money market and how a change in the money supply will affect the interest rate.
    • Show the effects of interest rate changes on investment spending.
    • Describe the impact of changes in investment on aggregate demand and equilibrium GDP.
  • Contrast the effects of an expansionary monetary policy with the effects of a restrictive monetary policy.
  • List two strengths and three shortcomings of monetary policy.
  • Define and identify terms and concepts at the end of the chapter.

Practice:

KEY GRAPHS:

Easy (Expansionary) Money Policy:


Tight (Contractionary) Money Policy:

Extra Videos:


10a The Spending Multiplier

Reading:

  • Chapter 10 ALL

Videos:

Outcomes / Must Know:

  • Describe the income-consumption and income-saving relationships
  • Recognize, construct, and explain the consumption and saving schedules.
  • Identify the determinants of the location of the consumption and saving schedules.
  • Calculate and differentiate between the average and marginal propensities to consume (and save).
  • Describe the relationship between the interest rate, expected rate of return, and investment
  • Identify the determinants of investment and construct an investment demand curve.
  • Identify the factors that may cause a shift in the investment-demand curve.
  • Describe the reasons for the instability in investment spending.
  • Provide an intuitive explanation of the multiplier effect.
  • Calculate the multiplier and changes in real GDP given information about changes in spending and the marginal propensities.
  • Discuss why the actual multiplier may differ from the theoretical examples.
  • Define and identify terms and concepts at the end of the chapter.

Practice:

KEY GRAPHS

Extra Videos:


13a Fiscal Policy 1

Reading:

  • Chapter 13 ALL
  • PLUS Review Ch. 18 pp. 374-378 "Taxation and Aggregate Supply"

Videos:

Outcomes / Must Know:

  • Explain expansionary fiscal policy and its effects on the economy and Federal budget.
  • Explain contractionary fiscal policy and its effects on the economy and Federal budget.
  • Explain how the multiplier effect is weakened when there is demand-pull inflation.
  • Give two examples of how built in stabilizers help eliminate recession or inflation.
  • Explain the differential impacts of progressive, proportional, and regressive taxes in terms of stabilization policy.
  • Explain the significance of the "cyclically-adjusted budget" concept.
  • Describe recent U.S. fiscal policy actions and the motivation behind them.
  • List three timing problems encountered with fiscal policy.
  • State political problems that limit effective fiscal policy.
  • Identify actions by households, and by state and local governments that can frustrate fiscal policy.
  • Define and identify terms and concepts at the end of the chapter.

Practice:

KEY GRAPHS

Extra Videos:


13b Fiscal Policy 2 and the Debt and Deficit

Reading:

  • Chapter 13 ALL
  • PLUS Review Ch. 18 pp. 374-378 "Taxation and Aggregate Supply"

Videos:

  •  

Outcomes / Must Know:

  • Differentiate between deficit and debt.
  • State the relative size of the debt as a percentage of GDP and describe how that has changed in recent years.
  • Describe the annual interest charges on the debt, who holds the debt, and the impact of inflation on the debt.
  • Explain why the debt can also be considered public credit.
  • Identify and discuss two widely held myths about the public debt.
  • Explain the real or potential effect of the debt on income distribution, economic incentives, fiscal policy, and private investment
  • Explain and recognize graphically how crowding out is a concern caused by a large public debt.

Practice:

Extra Videos:


OTHER

VIDEO SOURCES:

YouTube ACDCLeadership Macroeconomics Videos

Many students like these videos. I believe that "Mr. Clifford " began making these videos for his AP Economics students. I have watched many, but not all, of these videos and I usually like the way that he covers the topics. He does go quite fast, so the videos may be better for review than for an initial introduction to the topics. Note that his "units" do not match our units and he may cover more than we do in some areas but not all that we do in other areas.

Macroeconomics Playlists

TOPICS / LESSONS: Click on lesson number for assignments.

Unit 1: ECONOMICS and GLOBALIZATION

  • 1a - Syllabus, Math Quiz,
  • 1b - 5Es
  • 1c - What is Economics, Models, BCA, Budget Lines
  • 1d - PPC
  • 2a - Globalization / Structural Adjustment
  • 3a - Demand
  • 3b - Supply
  • 3c - Market Equilibrium
  • 20a - Why we Trade: Comparative Advantage
  • 20b - International Trade
  • 5a - Role of Gov't, Gov't Finance
  • 5b - Market Failures

Unit 2: INTRODUCTION TO MACROECONOMICS

Unit 3: MACROECONOMIC POLICY

  • 14a - What is Money,Money Market Model, and the Fed
  • 15a - How Banks Creatre Money
  • 16a - Monetary Policy
  • 16b - Other Macro Issues, Models
  • 10a - Multiplier
  • 13a - Fiscal Policy
  • 13b - Other FP Issues and Debt