
Unit 4: Labor and Efficiency: Resource
Markets, Inequality, and Immigration
Lesson 20a: Income Inequality and
Discrimination
Summaries of the Lesson 20a
Models
|
The Case for Equality
= The President Trump Example of the 5Es
The Occupational Segregation
Model of Discrimination
MODEL - The Case for Equality
= The President Trump Example of the 5Es
The Utility Maximizing Distribution of Income
Assumptions:
- assume that the money incomes of two
individuals, Joe and Jane, are subject to diminishing marginal
utility.
- In any time period, income receivers spend
the first dollars received on the products they value most,
products whose marginal utility is high.
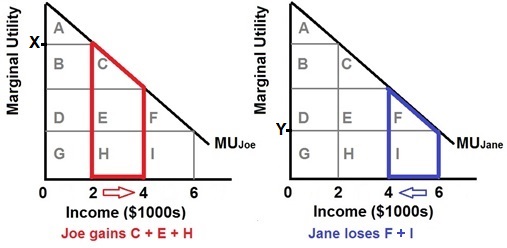
- The identical
diminishing-marginal-utility-from-income curves (MUjoe and MUjane
in the figure) reflect the assumption that Joe and Jane have the
same capacity to derive utility from income.
- income is initially unequally distributed
($2000 to Joe and $6000 to Jane), therefore, the marginal utility
derived from the last dollar will be greater for Joe (X) than for
Jane. (Y)
Conclusions:
- The basic argument for an equal
distribution of income is that income equality maximizes total
consumer satisfaction (utility) from any particular level of
output and income.
- If a single dollar of income is shifted
from Jane to Joe, that is, toward greater equality, then Joe's
utility increases by X and Jane's utility decreases by Y. The
combined utility then increases by X minus Y (Joe's large gain
minus Jane's small loss).
- The area under the MU curve and to the left
of the individual's particular level of income represents the
total utility of that income. Therefore, as a result of the
transfer of the $2000, Joe has gained utility represented by the
red area below curve MUjoe (area C + E + H), and Jane has lost
utility represented by the blue area below curve MUjane (area F +
I).
- The red area is obviously greater than the
blue area, so if the income distribution is initially unequal,
then distributing income more equally can increase the combined
utility of the two individuals.
Criticisms: Incentives and Efficiency (The
Equality-Efficiency Trade-off)
- Although the logic of the argument for
equality is sound, critics attack its fundamental assumption that
there is some fixed amount of output produced and therefore income
to be distributed.
- Critics of income equality argue that the
way in which income is distributed is an important determinant of
the amount of output, or income, that is produced and is available
for distribution. A more equal distribution of income may be a
disincentive to work and cause the total amount of income to
decrease. This is the Equality-Efficiency trade-off.
MODEL -The Occupational
Segregation Model of Discrimination
Assumptions:
- the labor force is comprised of 6 million
men and 6 million women workers
- the economy has 3 occupations, A, B, and C,
each having identical demand curves for labor
- men and women workers are homogeneous with
respect to their labor-market capabilities
- women are discriminated against by being
excluded from occupations A and B and are confined to
C
- except for discrimination, the economy is
competitive, therefore Dlabor = MRP = P x MP.
- There are no barriers to mobility between
the occupations for men.
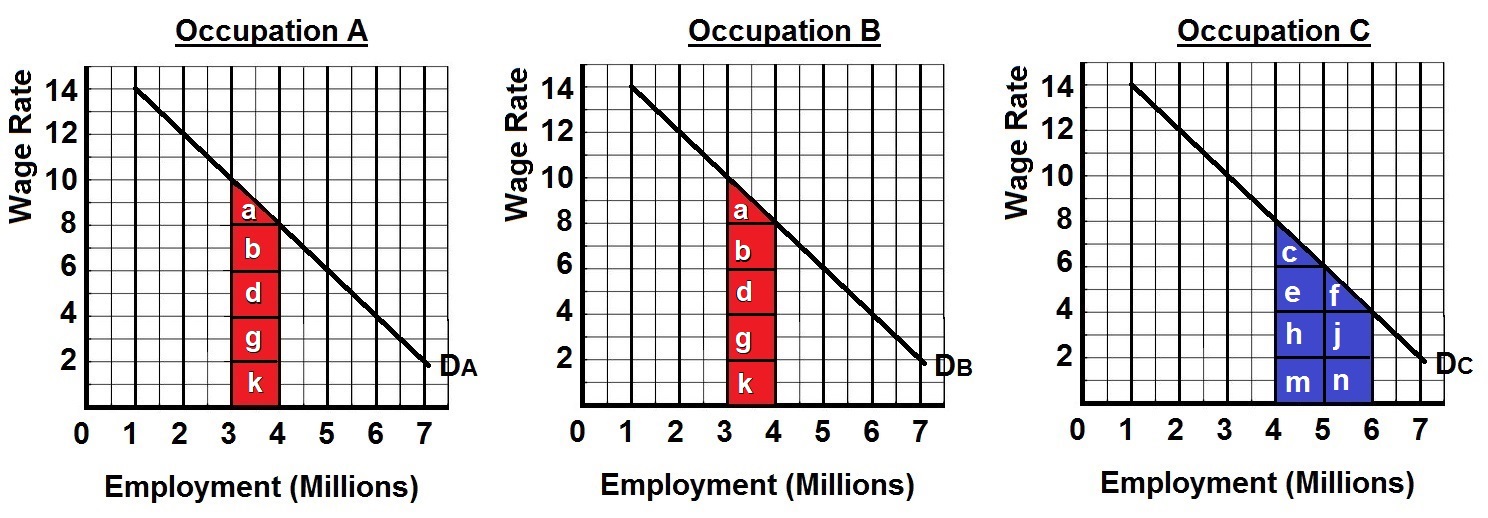
Conclusions:
- Men would distribute themselves equally in
occupations A and B (3 million in each) and earn high wages,
$10
- All 6 million women will be crowded into
occupation C and earn low wages, $4
- The result of discrimination is a loss of
output for society (less is being produced with the same number of
workers)
- Remember that labor demand reflects
labor's marginal revenue product (MRP = P x MP), which is
labor's contribution to domestic output.
- Thus, the red areas for occupations A
and B (a + b + d + g + k in each occupation) in the figure
above show the decrease in domestic output (MP x P) caused by
subtracting 1 million women from each of these occupations.
- Similarly, the blue area for occupation
C (c + e + h+ m + f + j + n) shows the increase in domestic
output caused by moving 2 million women into occupation C.
- Although society would gain the added
output represented by the blue area in occupation C, it would
lose the output represented by the sum of the red areas in
occupations A and B. That output loss exceeds the output gain,
producing a net output loss for society caused by
discrimination.
- If discrimination disappears, women,
attracted by higher wage rates, shift from occupation C to A and
B
- 1 million women move into A and another
1 million move into B.
- Ending discrimination clearly benefits
women, who now receive higher wages; it hurts men, who now
receive lower wages.
- Society gains. The elimination of
occupational segregation reverses the net output loss discussed
above. Society gains the output represented by the two red
areas in occupations A and B and loses the output represented
by the blue area in occupation C. When discrimination is ended
society gains more than it loses.