SUMMARY OF THE LABOR MARKET
MODELS
1. Competitive
labor market in a competitive product market
2. Competitive labor market in
an imperfectly competitive product market
3. Monopsony
4. Union Model: increasing
demand for labor
5. Union Model: craft
(exclusive) union
6. Union Model: industrial
(inclusive) union
7. Union Model: bilateral
monopoly
8. Minimum Wage (three
models)
a. traditional minimum wage model
b. minimum wage in a monopsony
c. minimum wage and the price elasticity of demand for labor

For EACH model know the following:
1.
assumptions, characteristics, and examples
2. graph
3. find the profit maximizing quantity of labor (this is the quantity
that WILL BE HIRED, where MRP = MRC)
4. find the allocatively efficient quantity of labor (where VMP = W,
or Qd=Qs)
You will find a summary of each of these eight (actually ten) models in our Yellow Pages. It is strongly recommended that you study these summaries.
REMEMBER: to find the profit maximizing quantity of workers to hire firms will continue to hire up to the point where MRP = MRC.
So for any questions that ask "how many will be hired?" or "what will the wage be?", the first thing you do is calculate MRP and MRC and then hire all where the MRP is greater than MRC (MRP > MRC) up to where MRP = MRC.


Explanation / Characteristics / Results:
Competitive Product Market (Pure Competition)
- Very many producers- Producing a standardized product
- No barriers to entry
- No market power
- The demand curve for the product is horizontal (perfectly elastic) at the market price
- We assume a competitive product market so Dlabor = MRP = VMP
- Example: Agriculture
Competitive Labor Market:
- Very many qualified workers with identical skills- Workers are therefore “wage takers” with no power to get a higher wage
- Therefore the supply of labor graph (Slabor = W) is horizontal (perfectly elastic) at the market wage
- Example: The market for unskilled labor – Walmart hiring unskilled workers
- Examples of Competitive Product Market in a Competitive Labor Market: Agriculture hiring unskilled labor
Result:
- Profit maximizing (equilibrium) quantity to hire is Q1 (where MRP = MRC)- Allocatively efficient quantity to hire is Q1 (where VMP = W)
- A competitive labor market in a competitive product market is efficient!

Explanation / Characteristics / Results:
Imperfect Competition in the Product Market (Monopoly or Oligopoly)
- One or Few producers- Significant barriers to entry
- A lot of market power
- The demand curve for the product is downward sloping – firm must lower its price to sell more
- Example: Monopolies and Oligopolies
Competitive Labor Market:
- Very many qualified workers with identical skills- Workers are therefore “wage takers” with no power to get a higher wage
- Therefore the supply of labor graph (Slabor = W) is horizontal (perfectly elastic) at the market wage
- Example: The market for unskilled labor
Examples of imperfectly competitive product market in a competitive labor market:
- Most businesses hiring unskilled labor- We know that monopolies and oligopolies will produce less and sell at a higher price and are allocatively inefficient in the product market, therefore they will hire fewer workers and are allocatively inefficient in the labor market.
Results:
- Profit maximizing (equilibrium) quantity to hire is Q1 (where MRP = MRC)- Allocatively efficient quantity to hire is Q2 (where VMP = W)
- A monopoly will produce less output so they will hire fewer workers. Inefficient!

Explanation / Characteristics / Results:
A single buyer of labor
Examples:
- Major employer in a small town- A mining town in Appalachia
- A Colorado ski town
Firm is a “wage maker” – they will try to pay as low a wage as possible, therefore the supply of labor graph is upward sloping.
MRC is higher than the wage because when they raise wages to hire more workers they must also raise the wages of all current employees which makes the cost of hiring another worker very high.
We assume a competitive product market so Dlabor= MRP = VMP
Results:
- Profit maximizing (equilibrium) quantity to hire is Q1 (where MRP = MRC)- Wage paid is W1
- Allocatively efficient quantity and wage is Q2 and W2 (where VMP = W)

Explanation / Characteristics / Results:
To increase wages some unions try to increase the demand for union labor
To keep things simple assume a competitive product market so Dlabor = MRP = VMP
How? (See determinants of labor demand lesson 12a)
- Increase demand for the products they produce
Example: unions lobby governments for more government construction projects- Increase demand for union labor by increasing the price of substitute resources
Example: unions support increases in the minimum wage even though union workers are already paid more than the minimum wage- Increase demand for union labor by decreasing the price of complimentary resources
Example: trucking unions support allowing more low wage foreign agricultural workers to enter the country so that there are more agricultural products to haul

Explanation / Characteristics / Results:
Some unions try to increase wages by reducing the supply of labor
To keep things simple assume a competitive product market so Dlabor = MRP = VMP
Examples – Some unions support:
- restricting immigration- laws banning child labor
- compulsory retirement
- shorter work week
Craft (or Exclusive) Unions
- A union of workers that all possess a certain skill- They then restrict membership in the union through various means including high fees and long apprenticeships
Examples: electricians union, carpenters union, plumbers union
- A similar technique to increase wages is used by professional organizations like the American Medical Association (doctors), the American Bar Association (lawyers) and the National Education Association (teachers) which try to set strict and difficult requirements for getting a license to work in their fields- Even barbers and hair stylists support licensing requirements that restrict how many people can cut and style hair.
Results:
- Therefore the firm will hire Q2 workers at a wage of W2. This is the equilibrium or profit maximizing quantity to hire with the union policies.- Allocatively efficient quantity to hire is Q1 (where VMP = W). Exclusive unions cause allocative inefficiency in the labor market.

Explanation / Characteristics / Results:
Inclusive (Industrial) Unions try to include all workers of a company in the union including skilled workers and unskilled workers, assembly line workers, secretaries, etc.
Then they increase wages by threatening to go on strike (all workers will stop working which will shut down the company).
To keep things simple assume a competitive product market so Dlabor= MRP = VMP
Examples:
- Autoworkers union- Steelworkers union
Result:
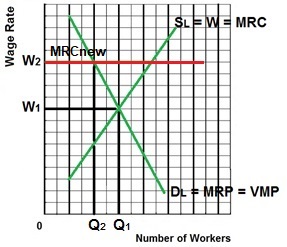
- W1 is the competitive wage if there is no union- W2 is the union negotiated wage rate
- Since all workers must be paid W2 it becomes the firms new MRC (extra cost of hiring one more worker)
- Therefore the firm will hire Q2 workers because this is where MRP = MRCnew (the new profit maximizing quantity to hire with the union contract)
- Q1 is the allocatively efficient quantity to employ (the competitive quantity) so inclusive unions cause allocative inefficiency in the labor market.
- At the Union wage of W2, Q3 workers want to work but only Q2 workers are hired creating a surplus of labor.

Explanation / Characteristics / Results:
A Bilateral Monopoly exists if you have an inclusive union working for a monopsony – a single seller of labor (the union) and a single buyer of labor (the large company)
Examples: Steel industry, automobile industry, professional sports teams, aircraft manufacturing
To keep things simple we assume a competitive product market so Dlabor = MRP = VMP
Result:
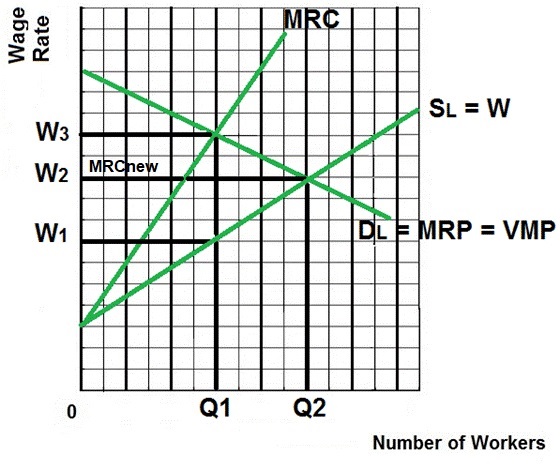
- Indeterminate; we can’t tell what the quantity of labor will be or the wage rate, it depends on negotiations between the company and the union- The efficient quantity of labor and wage is Q2 and W2 (where VMP = W)
- The company (monopsony) wants to pay W1 and hire Q1 where MRP = MRC (alloc. Inefficiency in the labor market)
- The union wants a wage of W3 and the firm will hire Q1 (alloc. Inefficiency in the labor market)
- After negotiations, the likely resulting wage will be between W1 and W3.
- If they negotiate a wage rate of W2 then that rate becomes the firms new MRC (the extra cost of hiring one more worker will be the negotiated wage rate) and the firm will hire Q2 (where MRP = MRCnew)
- Once the union and the company agree on a wage rate between W1 and W2:
* MORE WILL BE EMPLOYED* the labor market could achieve allocative efficiency (VMP = W at Q2)

Explanation / Characteristics / Results:
Assume that without the minimum wage we have a competitive product market and a competitive labor market.
Without the minimum wage Q1 will be employed at a wage of W1 and the labor market is allocatively efficient (MRP = MRC and VMP = W).
Results with a minimum wage set at W2:
- Higher wage (W2 instead of W1)- Fewer employed (Q2 instead of Q1; where MRP = MRCnew)
- Allocative inefficiency. Fewer workers than the efficient (competitive) quantity will be employed.
- Similar to what happens with an effective price floor in the product market.

Explanation / Characteristics / Results:
To keep things simple we assume a competitive product market so Dlabor = MRP = VMP
Example: Minimum wage in a non-unionized one industry town like a steel mill town, mining town in Appalachia, or a small Colorado ski town.
The allocatively efficient quantity is Q2 (where VMP = W)
Without minimum wage Q1 would be employed by the monopsonist at a wage of W1 (allocative inefficiency)
Results with a minimum wage set at W2:
- Wages increase from W1 to W2- Quantity of labor hired increases from Q1 to Q2 (where MRP = MRCnew)
* W2 becomes the firm’s new MRC curve (the extra cost of hiring one more worker is the minimum wage that they have to pay)* To maximize profits firms will hire the quantity of labor where MRP = new MRC
* With the minimum wage the profit maximizing quantity to hire for a monopsony will be Q2, more than what they would hire if they could pay a lower wage.
* The quantity of labor will be allocatively more efficient

Explanation / Characteristics / Results:
To keep things simple we assume a competitive product market so Dlabor = MRP = VMP
The traditional minimum wage model predicts less employment, but will the poor be better off even though more are unemployed? Will their total incomes be higher?
It depends on the price elasticity of demand for labor
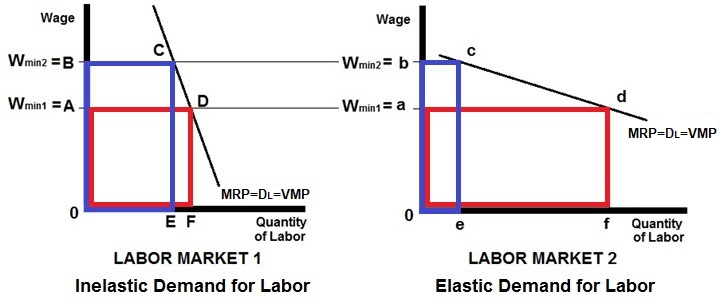
If the demand for labor is INELASTIC (see Labor Market 1 graph) :
raising the minimum wage from A to B will increase incomes from 0ADF to 0BCE (red to blue). This is good for the working poor.
If the demand for labor is ELASTIC (see Labor Market 2 graph):
raising the minimum wage from A to B will decrease incomes from 0adf to 0bce (red to blue). This is bad for the working poor.
Determinants of elasticity of labor demand (review from lesson 12a)
1. Ease of Labor Substitutability- If there are MANY SUBSTITUTES for labor, then the demand for labor is MORE ELASTIC- If there are FEW SUBSTITITES for labor, then the demand for labor is LESS ELASTIC
2. Elasticity of Product Demand
- If the demand for the product is MORE ELASTIC, the the demand for the labor used to produce the product is MORE ELASTIC- If the demand for the product is LESS ELASTIC, then the demand for the lavore used to make the product is LESS ELASTIC
3. Labor-Cost topTotal-Cost Ratio
- If the labor cost is a LARGE FRACTION of the total costs, then the demand fro labor is MORE ELASTIC- If the labor cost is a SMALL FRACTION of the total costs, then the demand for labor is LESS ELASTIC
|
|
|
|