- MONOPOLISTIC COMPETITION
- 10.1-2 Defining Monopolistic Competition
- 10.2-1 Short-Run Profit Maximization for a Monopolistically
Competitive Firm - Understanding Pricing and Output in
Monopolistic Competition
- Monopolistic
Competition (econclassroom.com 20:51)
efficiency begins at 15:00
- Monopolistic Competition in the Long-Run: Econ Concepts in
60 Seconds with AP Economics Teacher (ACDCEcon 3:25)
http://www.youtube.com/watch?v=erdzOu3juNI
- OLIGOPOLY
- SUMMARY
Monopolistic Competition
(econclassroom.com 20:51)
http://www.econclassroom.com/?p=3128
(efficiency begins at 15:00)
beginning at 15:00
- Are monopolistically competitive firms efficient?
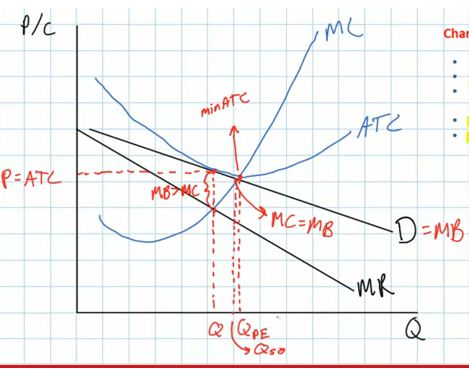
- Graph of a monopolistically competitive firm in long run
equilibrium
- firms earn a normal (zero) profit because of few
barriers to entry (P=ATC means zero profit)
- therefore there is no incentive for other firms to
enter
- Are they efficient? NO. Neither allocative or productive
efficiency will be achieved by monopolistically competitive
firms in the long run.
- Productive efficiency is NOT being achieved
- the profit maximizing quantity (Q) is not at the
lowest point on the ATC curve. The lowest point is where
MC-ATC (Qpe on the graph below)
- so to maximize profits, monopolistically competitive
firms will restrict output and charge a slightly higher
price than the minimum ATC
- Allocative efficiency is NOT being achieved
- We know that allocative efficiency occurs where MB=MC
(or MSB=MSC). On the graph MSB is measured by the demand
(or price) curve and the MSC is measured by the MC curve.
So, allocative efficiency occurs at the quantity where
P=MC.
- At the profit maximizing quantity we d]can see
that P>MC or MSB>MSC, so the firm is NOT
allocatively efficient.
- There will be an underallocation of resources (too
little will be produced). The quantity where P=MC (Qso)
is greater than the profit maximizing level of output
(Q).
- We will always get productive and allocative
inefficiency when the demand curve is downward
sloping so the MR is less than the price (demand)
- Only in pure competition do we get productive and
allocative efficiency
Monopolistic Competition in
the Long-Run: Econ Concepts in 60 Seconds with AP Economics
Teacher (ACDCEcon 3:26)
http://www.youtube.com/watch?v=erdzOu3juNI
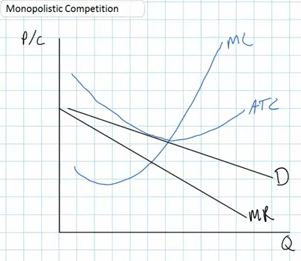
- How to draw a monopolistically competitive firm's long run
equilibrium graph
- downward sloping demand
- MR is below the Demand
- MC goes down at first ant then up
- IMPORTANT: NOW you must find the profit maximizing price and
quantity before you draw the ATC curve
- find the quantity where MR=MC
- then drive up to the demand curve and over to get the
price
- we need to know the price before we draw the ATC
curve
- then draw the ATC curve tangent to the demand curve (just
touching but not crossing) at the the profit maximizing price
(sweet spot).
- Now find the socially optimal quantity (the allocatively
efficient quantity)
- the alloc. eff. quantity occurs where P = MC. (On the video
he says this is "where supply equals demand" and he shows that
MC=S. This is the same as P=MC [or MC=P])
- result. the profit maximizing quantity, Q, (WHAT WE GET) is
less than the allocatively efficient quantity, Qso
(WHAT WE WANT).
- there is a deadweight loss
- Now find the productively efficient quantity
- this is at the minimum point of the ATC, or where
MC=ATC
- notice that the profit maximizing quantity is less than the
quantity where ATC is at a minimum, so monopolistically
competitive firms are not productively efficient. They do not
produce at the lowest ATC
- The difference between these two quantities is called
"excess capacity" meaning the firm could produce more at a
lower cost but they hold back production to increase their
profits
- Classic mistake when drawing the graph of monopolistic
competition in long run equilibrium:
- the classic mistake is drawing the ATC tangent to where
demand hits the MC curve
Kinked Demand Model
(econclassroom.com 14:06)
http://www.econclassroom.com/?p=3144
Preview:
- In this lesson we take a graphical approach to oligopoly, and
seek to explain why prices tend not to fluctuate up or down
in oligopolistic markets.
- Why do some oligopolies have very little incentive to decrease
their prices, and also a strong incentive not to raise their
prices?
- What emerges is a kinked demand curve, highly elastic at
prices above the current equilibrium and highly inelastic at
prices below the current equilibrium. Along with this kinked
demand curve comes a kinked marginal revenue curve, with a
vertical section. The implication is that even as an oligopolist’s
costs rise and fall in the short-run, its level of output and
price tends to remain stable.
Review - Oligopolies:
- few firms
- mutual interdependence
- Mutual interdependence exists when firms consider their
rivals' reactions while adjusting prices and outputs.
Assumptions about oligopoly
pricing behavior (kinked demand model)
- before changing its price an oligopolist will try to predict
what its competitors will do if they do change their price
- ASSUME: competitors will match price decreases - if one
firm lowers its price the competitors will lower their prices
- This make sense because the competitors will not want to
lose a lot of customers to a competitor that lowers it price,
so they will decrease their price too.
- therefore, the demand curve is inelastic, if all
firms lower their prices they will not gain very many
customers, i.e. the % change is quantity demanded will be small
= inelastic
- ASSUME: competitors ignore price increases - if one
firm raises its price the competitors will not raise their prices
- This makes sense because competitors could gain a lot of
customers if they kept their prices low when one firm raises
theirs
- therefore, the demand curve will be elastic, if one firm
raises its price and the other firms do not, the one firm will
lose a lot of customers, i. e. the % change in quantity
demanded will be large = elastic
So what does the demand curve
look like with these assumption?
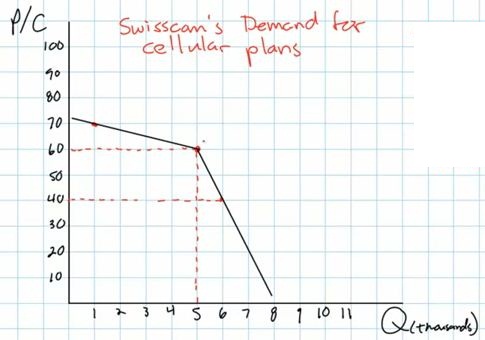
- demand below the going price will be inelastic (steeper); a
small increase in quantity if the price is decreased
- demand above the going price will be elastic (flatter); a
large decrease in quantity if the price is increased
- so the demand curve will be "kinked", or bent.
So why are firms reluctant to
change their prices?
- since demand is inelastic below the going price, if a firms
lowers its price (and its competitors do not) then its total
revenues will decrease; a big drop in price but a little increase
in quantity causes TR to decline
- since demand is elastic above the going price, if a firm
raises its price (and all its competitors raise their prices too)
then its total revenues will decrease; a little increase in price
but a large decrease in quantity causes TR to decline
- Therefore, prices in an oligopolistic market are "sticky";
i.e. they tend not to change because if a firms raises, or lowers
its price, its total revenues will fall
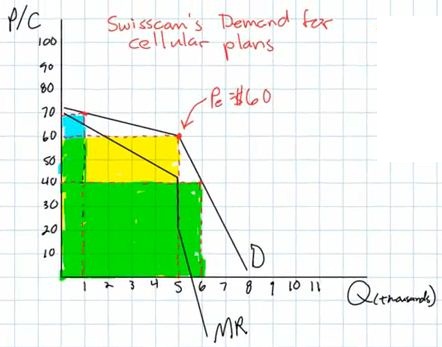
So what does the MR curve look
like?
- We know that when the demand curve is downward sloping, the MR
curve is below it
- the MR diminishes at twice the rate that demand does
therefore, we end up with two MR curves, one somewhat flat under
the elastic portion of the kinked demand curve and one more steep
under the inelastic portion of the demand curve, and a vertical
portion of the MR curve connecting the two
So what will oligopolists do if
their costs change? Will they change their prices and quantities?
- maybe not
- in other markets
- if variable costs rise, the MC will rise and the profit
maximizing level of output (where MR=MC) will decrease,
and
- if variable costs fall, the MC will fall and the profit
maximizing level of output (where MR=MC) will increase
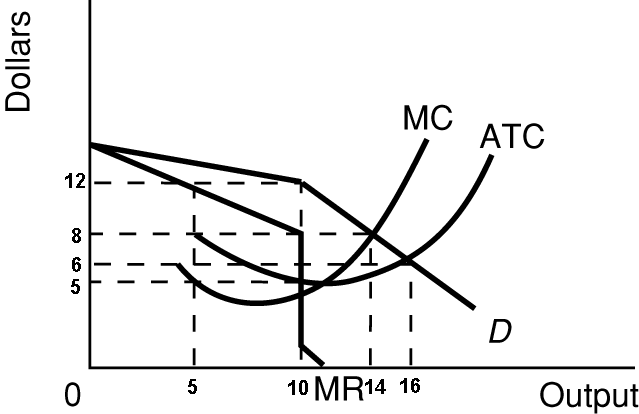
- but in the kinked demand model, if the MC crosses MR in the
vertical section, a change in costs will not change the profit
maximizing level of output or the profit maximizing price. the
price and quantity where MR = MC will stay the same even if MC
rises or falls
ME:
- Most economic textbook and online video lectures do not
include the ATC curve in their kinked demand model. I am not sure
why. And they often include 2 MC curves to show that changes in
costs do not change the profit maximizing quantity or price.
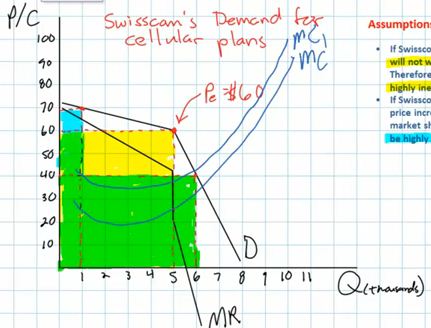
- here is a graph of the oligopoly kinked demand model with the
ATC curve and only one MC:
Oligopolies, Duopolies,
Collusion, and Cartels (Khan Academy 8:26)
http://www.khanacademy.org/finance-economics/microeconomics/v/oligopolies--duopolies--collusion--and-cartels
Introduction
- oligopoly
- "oli" means "few"
- "polies" means "sellers"
- sometimes oligopolies act more like monopolies and sometimes
they act more like competitive markets
Collusion (acting more like a
monopoly)
- if they coordinate their pricing and production decisions they
are acting more like a monopoly
- this is called collusion
- this is often illegal
- if they do it formally (like written agreements) then we call
it a cartel
- example of a cartel: OPEC (the Organization of Petroleum
Exporting Countries)
- 12 countries
- control 79% of the world's oil reserve (2012)
- and 44% of the world's oil production (2012)
- attempt to act like a monopoly
- one problem with collusion is that individual firms (or
countries as in OPEC) have an incentive to CHEAT: i.e. they might
be able to make more money if the say that they are going to
charge a high price like the rest of the firms, but then they
lower their price a take customers away from all the other
firms
Oligopolies that are More
Competitive
- Example: Coca-Cola vs.Pepsi
- Coke and Pepsi compete on price and on marketing
- a duopoly is an oligopoly with only two major
firms
- examples of oligopolies that compete (act more like pure
competition):
- Coca-Cola and Pepsi (duopoly)
- Boeing and Airbus (large passenger jet manufacturers -
duopoly)
- Airlines
- most cities have only a few airlines
- their products are very similar (standardized?)
- credit card (Visa, Mastercard, Discover American
Express)
- governments try to assure that oligopolies compete rather than
collude because collusion is inefficient (like monopolies) and
when they compete they are more efficient (more like pure
competition) with a larger consumer plus producer surplus (total
surplus).
SUMMARY
Determining the Efficiency
of Firms in Different Market Structures (econclassroom.com
18:23)
http://www.econclassroom.com/?p=4456
Introduction
- two types of efficiency
- productive efficiency
- producing at the level of output where its ATC is
minimized
- is the price equal to the minimum ATC
- ME: quantity where MC=ATC
- allocative efficiency
- producing at the level of output where the MB = MC
- achieved where P=MC (or D=MC)
- the demand curve represents the MB that consumers
receive from the consumption of a good
- also called the socially optimal quantity
-
Perfect Competition Long Run
Equilibrium
- very many firms producing standardized (identical) products
with no barriers to entry
- demand perfectly elastic (firm is a price taker) since there
are very many firms producing identical products and no individual
firm has any market power
- D=P=MR
- equilibrium price is established in the market (supply and
demand in the market)
- zero (normal) economic profits in long run equilibrium because
of no barriers to entry so ATC touches demand at the lowest point
of the ATC curve
- quantity produced is where MR=MC (Qpc)
- productive efficiency is achieved
- equilibrium quantity (Qpc) is where ATC is at a minimum
(P=minimum ATC)
- produce the quantity where MC=ATC
- if they produce at any other quantity then the ATC will be
greater than the price and they will earn economic losses and
will go out of business in the long run
- allocatively efficiency is achieved
- at the profit maximizing quantity (Qpc) the P=MC
- MSB=MSC
- this is the socially optimal quantity
Monopoly Long Run
Equilibrium
- single firm in the industry since entry is blocked
- producing a unique product
- downward sloping demand since the monopolist has market power
since it produces a unique product that no other firms produce and
the demand (or P) is greater then the MR
- D=P>MR
- long run profits likely shown on graph as the ACT is below the
demand (P) curve because entry is blocked (yellow rectangle)
- quantity produced is where MR=MC (Qm)
- productive efficiency is NOT achieved
- equilibrium quantity (Qm) is NOT where ATC is at a minimum
(P>minimum ATC)
- they do NOT produce the quantity where MC=ATC
- at the profit maximizing level of output (Qm) the actual
ATC is higher than the minimum ATC
- since there is no competition the firm does not need to
produce in the least cost manner; without competition the firm
can charge a much higher price and produce at a higher ATC and
earn greater profits
- allocative efficiency is NOT achieved
- equilibrium quantity (Qm) is NOT at the quantity where P=MC
(Qso)
- at the profit maximizing level of output (Qm), P>MC
- meaning that there is an underallocation of resources; too
little is being produced
- monopolists can restrict output to increase the price and
earn greater profits
- at the socially optimal (alloc. eff.) quantity (Qso),
profits are not maximized so the monopolist will not produce
this quantity
Monopolistic Competition Long
Run Equilibrium
- many firms in the industry producing similar products
- some market power (price making power) because of product
differentiation
- downward sloping demand for the individual firms but more
elastic since there are many substitutes and the demand (or P) is
greater then the MR
- D=P>MR
- zero (normal) economic profits in long run equilibrium because
of few barriers to entry so ATC is tangent to the demand
curve
- quantity produced is where MR=MC (Qmc)
- productive efficiency is NOT achieved
- equilibrium quantity (Qmc) is NOT where ATC is at a minimum
(P>minimum ATC)
- they do NOT produce the quantity where MC=,ATC
- at the profit maximizing level of output ATC is higher than
the minimum
- allocative efficiency is NOT achieved
- equilibrium quantity (Qmc) is NOT at the quantity where
P=MC
- at the profit maximizing level of output (Qmc),
P>MC
- meaning that there is an underallocation of resources; too
little is being produced
- as long as firms have some market power (i.e. the demand is
downward sloping) they will maximize profits by producing a
quantity that is less than the socially optimal quantity
(Qso)
Summary
- imperfect competition (monopoly, monopolistic competition, and
oligopoly) is a form of market failure; the market fails to
achieve efficiency as we saw in this lesson
- ME: we studied market failure when we studied externalities in
chapter 5; when externalities exists markets fail to achieve
efficiency
- ME: in chapter 2 where we studied the economic functions of
government, one of the functions was to try to maintain
competition ;i.e. to correct markets when they fail to achieve
efficiency; we also studied this in chapter 18 when we discussed
antitrust laws and monopoly regulation
- since most industries are imperfectly competitive, does this
mean that the most markets are market failures?
- if we just look at the graphs we would have to answer
"yes", "technically speaking"
- but there are also some benefits to imperfectly competitive
markets that also have to be considered:
- the great degree of product differentiation provides
society with a lot of benefits that may make up for some of
the underallocation of resources (customer service,
innovation, product development); variety is good


