| 2. |
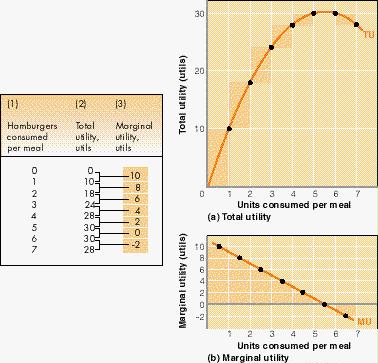 FIGURE 21-1 Total and
marginal utility Curves TU and MU are graphed from the data in the table. (a) As more of a
product is consumed, total utility increases at a diminishing rate, reaches a maximum, and
then declines. (b) Marginal utility, by definition, reflects the changes in total utility.
Thus marginal utility diminishes with increased consumption, becomes zero when total
utility is at a maximum, and is negative when total utility declines. As shown by the
shaded rectangles in (a) and (b), marginal utility is the change in total utility
associated with each added hamburger. Or, alternatively, each new level of total utility
is found by adding marginal utility to the previous level of total utility. FIGURE 21-1 Total and
marginal utility Curves TU and MU are graphed from the data in the table. (a) As more of a
product is consumed, total utility increases at a diminishing rate, reaches a maximum, and
then declines. (b) Marginal utility, by definition, reflects the changes in total utility.
Thus marginal utility diminishes with increased consumption, becomes zero when total
utility is at a maximum, and is negative when total utility declines. As shown by the
shaded rectangles in (a) and (b), marginal utility is the change in total utility
associated with each added hamburger. Or, alternatively, each new level of total utility
is found by adding marginal utility to the previous level of total utility. |
| R-1 21-1 |
Marginal utility in Figure 21-1b is positive, but declining, when total utility in
Figure 21-1a is positive and:
|