| 4. |
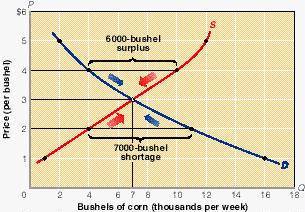
FIGURE 3-5 Equilibrium price and quantity. The intersection of the downsloping demand
curve D and the upsloping supply curve S indicates the equilibrium price and quantity,
here $3 and 7000 bushels of corn. The shortages of corn at below-equilibrium prices, for
example, 7000 bushels at $2, drive up price. These higher prices increase the quantity
supplied and reduce the quantity demanded until equilibrium is achieved. The surpluses
caused by above-equilibrium prices, for example, 6000 bushels at $4, push price down. As
price drops, the quantity demanded rises and the quantity supplied falls until equilibrium
is established. At the equilibrium price and quantity, there are neither shortages nor
surpluses of corn. |
| R-1 3-5 |
At price $5 in this market:
|