OUTLINE -- CHAPTER 9
Producer Decisions: Benefits (Pure Competition)
[Class Handout: Three Rules and Four Models (.doc)
(.htm)]
I. Benefit-Cost Analysis and Producer Decisions
A. Decision: How Many to Produce:
B. Goal: Maximize Profits
C. Benefit Cost Analysis:
all where: MB > MC
up to where: MB=MC
but never where: MB<MC
II. The Product Market
A. Circular
Flow Model
B. Four Product Market Models
1. Competitive
Market (Ch. 9)
2. Monopoly
(Ch. 10)
3. Monopolistic
Competition (Ch. 11)
4. Oligopoly
(Ch. 11)
C. General Outline for Each Model
1. Characteristics and Examples
2. Nature of the Demand Curve
3. Short Run Equilibrium (Profit Max.)
4. Long Run Equilibrium and Efficiency
5. Other Issues
III. Pure Competition.
A. Definition
A market structure in
which a very large number of firms sell a standardized product
into which entry is very easy in which the individual seller
has no control over the product price and in which there is no
nonprice competition; a market characterized by a very large
number of buyers and sellers.
B. Characteristics of Competitive Markets
1. NUMBER OF FIRMS: very large numbers
2. TYPE OF PRODUCT: standardized product
3. CONTROL OVER PRICE: "price takers"
A seller (or buyer) of
a product or resource who is unable to affect the price at
which a product or resource sells by changing the amount it
sells (or buys).
4. EASE OF ENTRY: free entry
5. NONPRICE COMPETITION: none
C. Examples / Relevance
1. applying benefit cost analysis
2. competitive markets used as the "standard" of efficiency
3. agriculture
D. Demand and Competitive Markets
1. demand faced by the firm is
perfectly elastic
2. market demand is downsloping
IV. Short Run Profit Maximization: Benefit-Cost Analysis
Approach
A. Benefit-Cost Analysis
1. definition
the selection of ALL possible alternatives where
the marginal benefits are greater than the marginal cost
select all where: MB
> MC
up to where: MB = MC
but never where: MB < MC
2. marginal costs = MC (ch. 8)
3. What are the MBs of selling one more unit of output?
marginal benefits =marginal revenue (MR)
a) total revenue (TR = P x Q)
b) MR =  TR /
Q
TR /
Q
B. Profit Maximization -- Applying Benefit-Cost
Analysis
1. step 1: find best quantity (where MR = MC)
2. step 2: are AR > AVC? If yes, then produce this
quantity
3. calculate profits
a) profits = TR - TC
b) check to see if profits are maximized
How
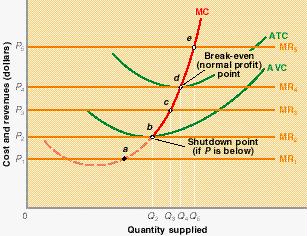
to find the profit maximizing quantity:
A
firm will maximize its profit (or minimize its losses) by
producing that output at which marginal revenue and
marginal cost are equal provided product price is equal
to or greater than average variable cost
(1)
Find the quantity where: MR=MC
(2)
produce this quantity if: AR > AVC
|
C. Three Cases -- using BOTH cost schedules and
graphs
1. profit maximizing case
a) step 1: find quantity where MR = MC
b) step 2: are AR > AVC? If yes, then produce this
quantity
c) calculate profits
d) textbook
graph, graph
2. loss minimizing case
a) step : find quantity where MR = MC
b) step 2: are AR > AVC? If yes, then produce this
quantity
c) calculate profits
d) check to see if losses are minimized
e) why not close down?
f) graph
3. shutdown case
a) step 1: find quantity where MR = MC
b) step 2: are AR > AVC? If yes, then produce this
quantity
c) calculate profits/check
d) graph
4. Quick
Review Quiz / Quick
Review Quiz
D. Marginal Cost and the Short Run Supply Curve
- A supply curve
which shows the quantity of a product a firm in a purely
competitive industry will offer to sell at various prices in
the short run;
- the portion of
the firm’s short-run marginal cost curve which lies above
its average variable cost curve.
graph

V. Profit Maximization: total cost minus total revenue
approach
A. Short Run
B. Graphs
VI. Profit Maximization in the Long Run
A. Assumptions
B. LR Equilibrium: competitive markets
1. "After all long-run adjustments are
completed, product price will be exactly equal to, and
production will occur at, each firm's point of minimum average
total cost"
2. zero profit (normal profit) model
C. Why?
1. entry of firms eliminates profits (graph)
From the Textbook:
|
IF DEMAND INCREASES,
PRICE WILL INCREASE
NEW FIRMS WILL ENTER
AND PRICE WILL FALL BACK TO WHERE IT WAS
|
PROFITS WILL RETURN TO NORMAL (ZERO)
|
|
|
|
2. exodus of firms eliminates losses
(graph)
From the Textbook:
|
IF DEMAND DECREASES,
PRICE WILL DECREASE
FIRMS WILL GO OUT OF BUSINESS
AND PRICE WILL RISE BACK TO WHERE IT WAS
|
PROFITS WILL RETURN TO NORMAL (ZERO)
|
|
|
|
D. Pure
competition: Long-run equilibrium graph
F. Long Run Supply Curve
A
schedule or curve showing the prices at which a purely
competitive industry will make various quantities of the
product available in the long run.
1. constant cost industry
An
industry in which expansion or contraction will not affect
resource prices and therefore production costs
Graphically,
it means the entry or exit of firms does not shift the
long-run ATC curves of individual firms
Occurs when
the industry's demand for resources is small in relation to
the total demand for those resources
2. increasing cost industry
An
industry in which expansion through the entry of new firms
increases the prices firms in the industry must pay for
resources and therefore increases their production
costs.
3.
decreasing cost industry
An
industry in which expansion through the entry of firms
decreases the prices firms in the industry must pay for
resources and therefore decreases their production
costs.
VII. Pure Competition and Efficiency !!!!!!!!!!!!!!!!
A. Competitive Markets Used as Standard of
Efficiency
B. Productive Efficiency
1. definition
The
production of a good in the least costly way or
producing at a minimum cost
2. P = minimum ATC (MC=ATC)
productive
efficiency occurs when production takes place at the output at
which average total cost is a minimum
3. Pure
competition: Long-run equilibrium graph
How
to find the productively efficient quantity:
Society
will achieve productive efficiency by producing that
output at which the average total cost (ATC) is at a
minimum
MC
= ATC
|
C. Allocative Efficiency
1. definition
The
apportionment of resources among firms and industries to
obtain the production of the products most wanted by society
(consumers);
2. MSB = MSC
( To review MSB, MSC and Efficiency see
supply, demand, and
economic efficiency from chapter
3 )
3. The allocatively efficient quantity: P = MC
Allocative
efficiency is achieved at the output of each product at
which its marginal cost and price or marginal benefit are
equal (P = MC).
a. MSB =
P
b. MSC = MC
c. Therefore: MSB = MSC where P = MC
4.
Pure
competition: Long-run equilibrium graph
5. allocative inefficiency
a. underallocation of resources: P > MC
b. overallocation of resources: P < MC
How
to find the allocately efficient quantity:
Society
will achieve allocative efficiency by producing that
output at which price and marginal cost are equal
P=MC
|
5. marginal cost pricing
To achieve allocative efficiency: MSB should
equal MSC
If P measures MSB and MC measure MSC then to achieve
allocative efficiency:
P should equal MC
EXAMPLES:
a. all you can eat / free refills
- what are the MSC to society (MC to the firm) of
having one more?
- what is the price (P) to the consumer of having
one more?
- does P=MC (or MSB=MSC) ?
- if not, is P>MC or is P< MC ?
- is allocative efficiency achieved? - or is there
an OVER- or UNDER-allocation of resources?
b. electricity rates
- summer vs. winter
- when is the MC higher?
- therefore, to achieve allocative efficiency,
when should the price be higher?
- if the price is not higher what might
happen?
- days vs. evening (making snow only at night -
why?)
- Why do they only make snow at night?
- when is the MC lower?
- therefore, to achieve allocative efficiency,
when should the price be lower?
c. plane fares
- what is the MC of adding one more traveler to a
plane that is half full?
- what is the MC of adding one more traveler to a
plane is is full?
- Why do they charge less for "standby"?
- Is this efficient?
d. rent with utilities included
- what are the MSC to society (MC to the firm) of
turning the heat up in the winter?
- what is the price (P) to the consumer of turning
the heat up in the winter?
- does P=MC (or MSB=MSC) ?
- if not, is P>MC or is P< MC ?
- is allocative efficiency achieved or is there an
OVER- or UNDER-allocation of resources?
e. bus fares
- when is the cost (MC) to the bus company, or the
cost to society (MSC), greater?
- at rush hour ?
- or at noon hour ?
- when should the price be higher to achieve
allocative efficiency?
f. parking meters
- when is the cost to society (MSC) of allowing one
more person to park greater?
- week days when there are few or no available
parking spaces?
- weekends when there are many available parking
spaces?
- when should the price be higher to achieve
allocative efficiency?
- what should the price be on weekends to be
allocatively efficient assuming that there are very many
empty parking spaces available?
g. garbage collection and recycling
h. tollway fares
- when is the cost to society (MSC) of allowing one
more car on the tollway greater?
- rush hour when there is a lot of
traffic?
- noon hour when there is very little
traffic?
- when should the price be higher to achieve
allocative efficiency?
- how does this save resources?
i. external costs anad external benefits (spillover
costs and benefits) (see chapters 4 and 16)
j. other
D. Dynamic Adjustments / dynamic efficiency
VIII. Qualifications (Shortcomings) of the Competitive
Price System
A. Income Distribution Problems (Equity)
B. Market Failures: Spillovers and Public Goods
C. Productive Techniques
1. natural monopolies
2. technological progress (Dynamic Efficiency)
a. incentive
b. means
D. Range of Consumer Choice