|
10.
|
|
|
|
R-1 F30020
|
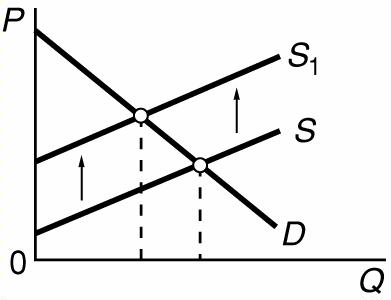
Refer to the above diagram in which S is the
market supply curve and S
t is a supply curve
comprising all costs of production, including external
costs. Assume that the number of people affected by these
external costs is large. If the government wishes to
establish an optimal allocation of resources in this
market, it should:
|