OUTLINE -- LESSONS 7a, 7b, 7c

OPTIONAL

The Costs of Production

7a - Economic Profit and the Production Function

I. Producer Decisions: Costs

A. Decision: How Many to Produce?
B. Goal: Maximize Profit
C. Benefit Cost Analysis:
all where: MB > MC

up to where: MB=MC

but never where: MB<MC

II. Economic Costs

A. All Costs = Opportunity Costs
economic (opportunity) cost:
  • A payment which must be made to obtain and retain the services of a resource;

  • The income a firm must provide to a resource supplier to attract the resource away from an alternative use;

  • Equal to the quantity of other products which cannot be produced when resources are instead used to make a particular product.

B. Explicit and Implicit Costs

1. explicit costs = payments to nonowners for resources
The monetary payment a firm must make to an outsider to obtain a resource.

2. implicit costs = what self-employed resources could have earned elsewhere

The monetary income a firm sacrifices when it uses a resource it owns rather than supplying the resource in the market;

Equal to what the resource could have earned in the best-paying alternative employment.

3. Accoutin Profit / Economic Profit / and Normal Profit
[Why a ZERO profit in economicds is good]

Profit - TR - TC
a. normal profits = a cost
definition
The payment made by a firm to obtain and retain entrepreneurial ability;

The minimum income which entrepreneurial ability must receive to induce it to perform entrepreneurial functions for a firm.


b. economic profits = TR - total opportuniy costs
definition:
  • The total revenue of a firm less all its economic costs;
  • Also called “pure profit” and “above normal profit.”

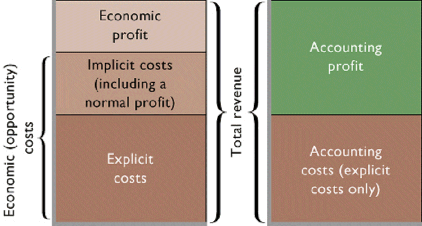
Economic profits = TR - explicit AND implicit costs

if economic profit = 0 called normal profit

c. accounting profit = Total Revenue - Explicit Costs

d. compare:
II. Preview

A. two sets of graphs
1. How output changes with as more resourses are added
a. explanation
b.
graph

2. How costs vary with output

a. total costs: graph

b. average costs: graph

c. graphs


III. Production Costs in the Short Run
Short Run vs. Long Run at About.com

A. Short Run and Long Run
short run
A period of time in which producers are able to change the quantity of some but not all of the resources they employ;

A period in which some resources (usually plant) are fixed and some are variable

long run

In microeconomics a period of time long enough to enable producers of a product to change the quantities of all the resources they employ;

A period in which all resources and costs are variable and no resources or costs are fixed.

B. How Output Changes as More Resources are Added in the Short-?Run
[Short-Run Production Relationships]

1. definitions and calculations
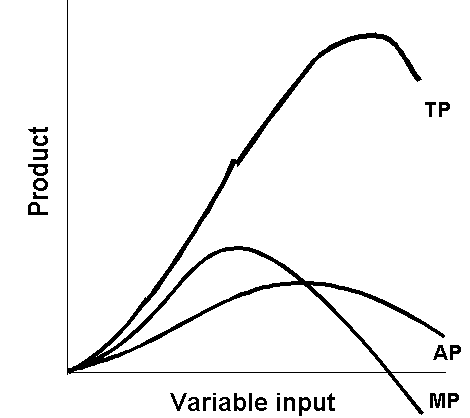
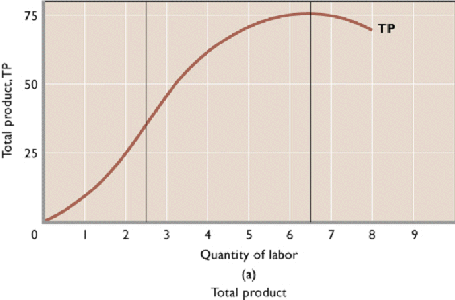
a) total product (TP)
The total output of a particular good or service produced by a firm (or a group of firms or the entire economy).

b) average product (AP)

The total output produced per unit of a resource employed (total product divided by the quantity of that employed resource).

AP = TP / Qres

c) marginal product (MP)

The additional output produced when one additional unit of a resource is employed (the quantity of all other resources employed remaining constant);

Equal to the change in total product divided by the change in the quantity of a resource employed.

MP = TP / Qres

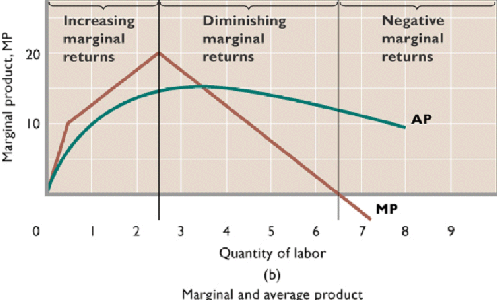
2. graph

a. yellow page
b.
graph
c.
textbook
d.
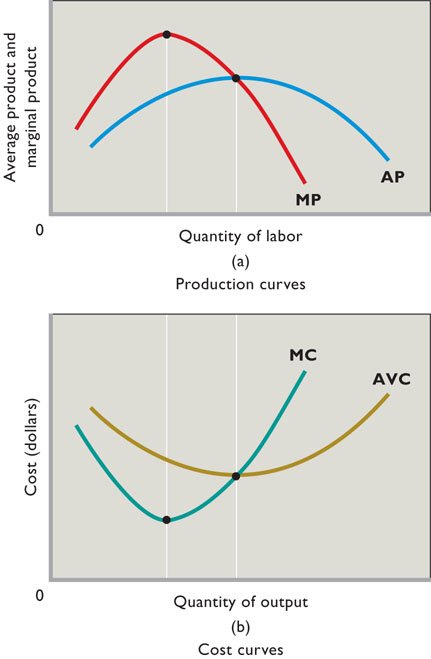
MP and AP
  • GPA vs. MGP (marginal grade point or this semester's GPA)

3. law of diminishing marginal returns

a) increasing marginal returns

b) diminishing marginal returns

c) negative marginal returns

d) Law of Diminishing Marginal Returns

As successive increments of a variable resource are added to a fixed resource the marginal product of the variable resource will eventually decrease.

Rationale:

  • gets crowded
  • example from textbook:
    • weeding a cornfield once, twice, three times, more
    • what happens to the increase in yields each time

4. Quick Review Quiz

7b - Production Costs in the Short Run

C. SHORT RUN COSTS: How Costs Vary With Output -- three families of costs
1. total costs -- definitions, calculations and graphs
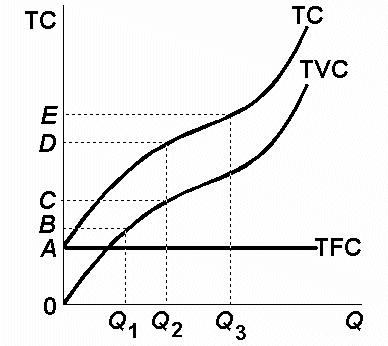
a) total fixed costs (TFC)
Any cost which in total does not change when the firm changes its output; the cost of fixed resources.

b) total variable costs (TVC)

A cost which in total increases when the firm increases its output and decreases when it reduces its output.

c) total costs (TC)

The sum of fixed cost and variable cost.
TC = TFC + TVC

c) graph

2. average costs -- definitions, calculations and graphs

a) average fixed costs (AFC)
A firm’s total fixed cost divided by output (the quantity of product produced).
AFC = TFC / Q

b) average variable costs (AVC)

A firm’s total variable cost divided by output (the quantity of product produced).
AVC = TVC / Q

c) average total costs (ATC)

A firm’s total cost divided by output (the quantity of product produced);
ATC = TC / Q

Also equal to average fixed cost plus average variable cost.

ATC = AFC + AVC

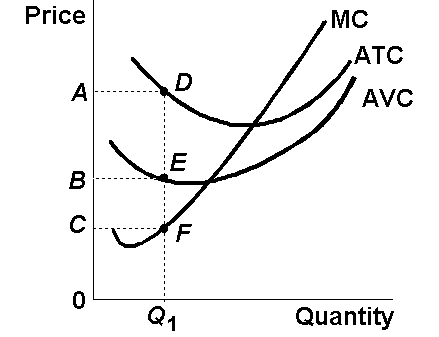
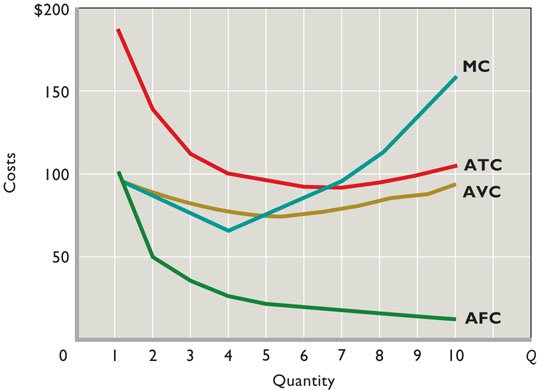
3. marginal costs (MC)

a) definition
The extra (additional) cost of producing one more unit of output;

b) calculation

equal to the change in total cost divided by the change in output
MC = TC / Q

Also, in the short run equal to the change in total variable cost divided by the change in output.

MC = TVC / Q

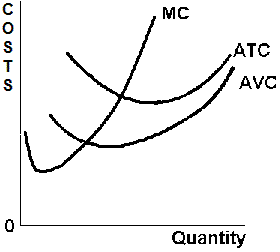
c) graphs

1) yellow page

2) graph

3) textbook

4) textbook 2


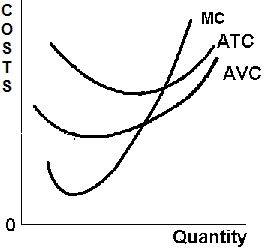
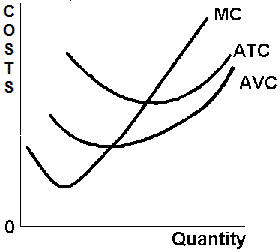
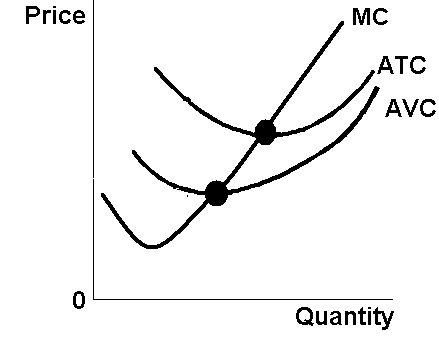
d) relation of MC to AVC and ATC

  • MATCHING: Which graph is drawn correctly?

A
B
C


MC crosses AVC and ATC at their LOWEST POINTS:

WHY? Rmember the GPA vs. MGP example?


e. Relation of MC and MP


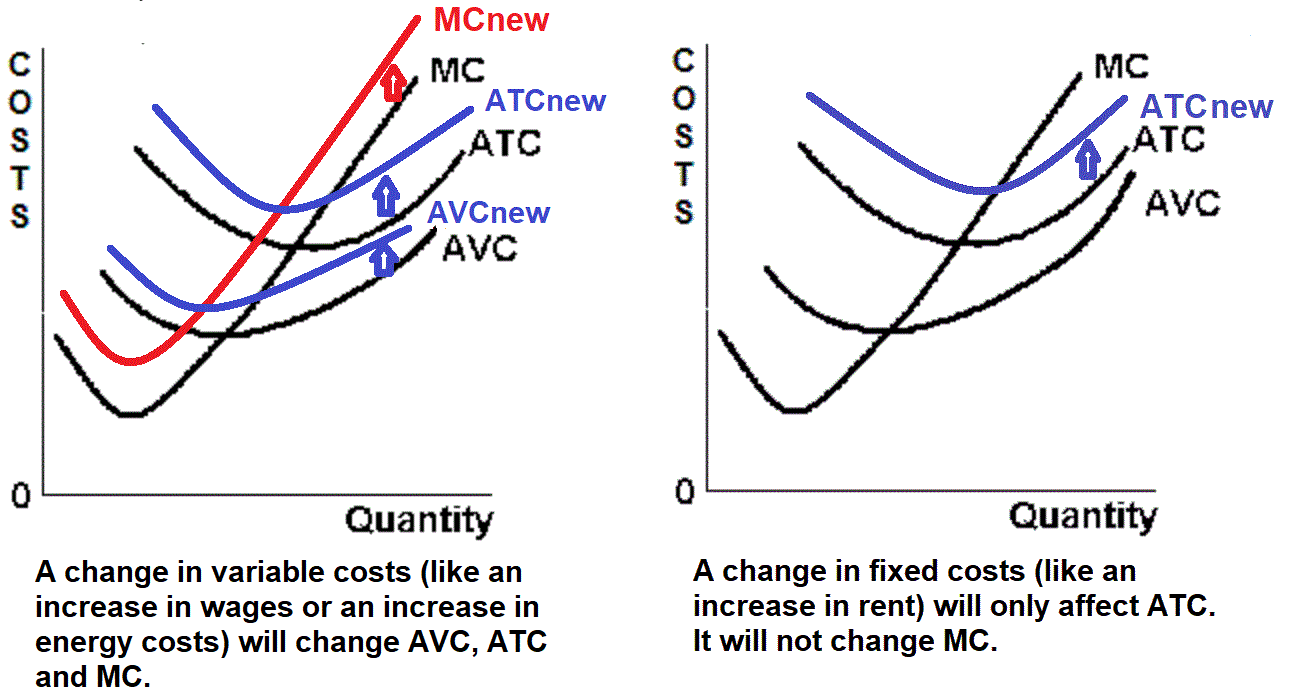
IIV. Shifting the Cost Curves


7c - Production Costs in the Long Run


V. Production Costs in the Long Run

A. Long Run and Efficiency
NOTE: The long-run graphs will be used in lessons 8/9b, 10b, 11a, and 11b to find EFFICIENCY

B. LR-ATC curve and Alternative Plant Sizes

C. Economies and Diseconomies of Scale

1. economies of (large) scale
a) explanation
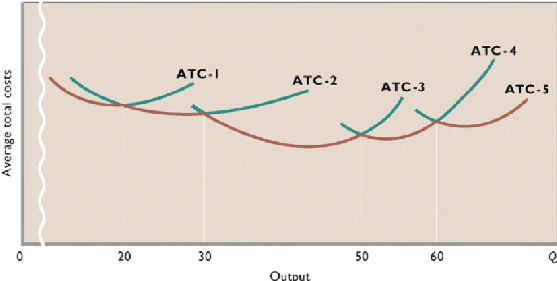
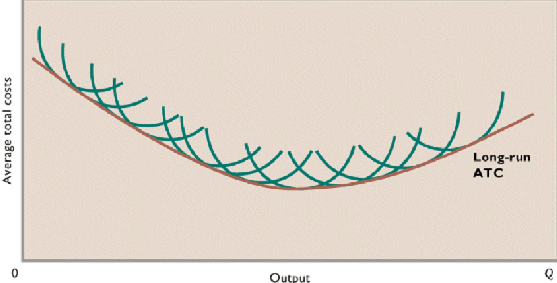
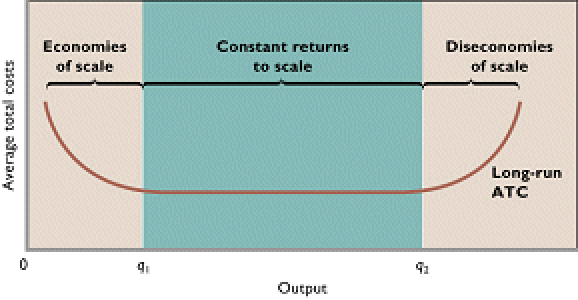
Reductions in the average total cost of producing a product as the firm expands the size of plant (its output) in the long run; the economies of mass production.

b) 5 Plant Sizes

c) Many Plant Sizes

d) rationale

(1) labor specialization
(2) managerial specialization
(3) productively efficient use of capital
(4) other factors:
  • such as design, development, or other "start up" costs such as advertising and "learning by doing."

2. diseconomies of (large) scale

a) explanation
Increase in the average total cost of producing a product as the firm expands the size of its plant (its output) in the long run.

b) graphically

c) rationale: some reasons include distant management, worker alienation, and problems with communication and coordination.

3. constant returns to scale

a) explanation
A situation wherein long-run average cost does not change.

A given percentage increase in all outputs will cause a proportionate percentage increase in output.

In this range, ATC remains constant.

graph

b) graphically

c) rationale


4. Graphs


4. Quick Review Quiz

D. MES and Industry Structure

1. definition: Mininmum Efficient Scale
The lowest level of output at which a firm can minimize long-run average costs

graph

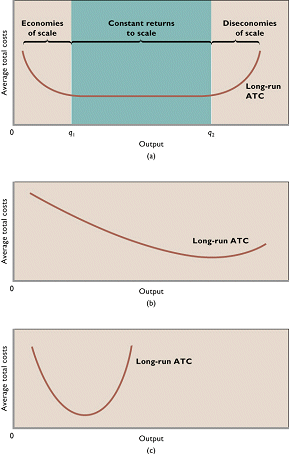
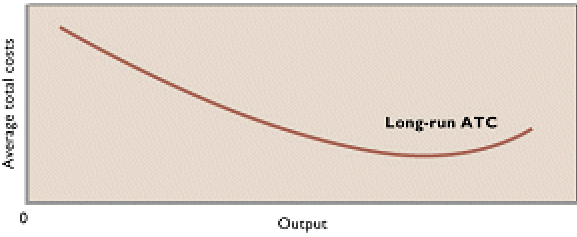
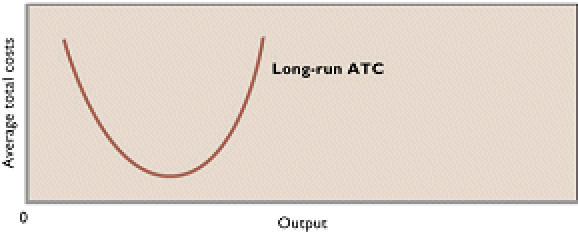
2. graph - three possible long run ATC curves

  • Constant Returns to Scale explains why relatively large and small firms could coexist in an industry and be viable.
  • Result: LARGE and SMALL firms are able to compete
  • Examples: apparel, food processing, furniture, wood products, snowboards, small appliances


  • In other industries the long-run average cost curve will decline over a wide range of output. Given consumer demand efficient production will be achieved only with a small number of large firms.
  • Result: firms are LARGE, but only a FEW exist
  • Examples: Automobile, aluminum, steel, computer chips, internet service prviders (?)
  • When economies of scale extend beyond the market size the conditions for a natural monopoly are produced wherein unit costs are minimized by having a single firm produce a product.

  • When economies of scale are exhausted quickly
  • Result: firms will be SMALL, but MANY will exist
  • Examples: retail, some farming, light manufacturing, (baking, clothing, shoes)


 E. Applications and illustrations.


 1. As gas prices rise, it causes most firms' short-run variable costs to also increase since most firms use gasoline to some extent, thereby increasing the AVC, MC, and ATC.

2. Recently there have been a number of start-up firms that have been able to take advantage of economies of scale by spreading product development costs and advertising costs over larger and larger units of output and by using greater specialization of labor, management, and capital.

3. I n 1996 Verson (a firm located in Chicago) introduced a stamping machine the size of a house weighing as much as 12 locomotives. This $30 million machine enables automakers to produce in 5 minutes what used to take 8 hours to produce. To justify use of this machine, the auto manufacturer has to be a large producer, so that the fixed costs of the machine are spread over a large output.

4. With the internet there's a decrease in news readership and advertising in newspapers raising AFC

5. This results in a higher AFC (fixed costs are spread out over a smaller level of output) forcing newspaper companies to increase their prices which causes a further reduction in news readership, resulting in many newspaper companies to go bankrupt.

6. The aircraft assembly and ready-mixed concrete industries provide extreme examples of differing MESs. Economies of scale are extensive in manufacturing airplanes, especially large commercial aircraft. As a result, there are only two firms in the world (Boeing and Airbus) that manufacture large commercial aircraft. The concrete industry exhausts its economies of scale rapidly, resulting in thousands of firms in that industry.